
Macroeconomic overview
Following several years of relatively weak economic performance, growth in the EBRD regions averaged 3.8 per cent in 2017 – the second consecutive year of strengthening growth. That growth was broadly based, with support provided by stronger investment activity and increases in exports. In the longer term, the growth trajectories of countries in the EBRD regions are, to a large extent, shaped by those countries’ demographic profiles. When analysing countries’ economic performance, the concepts of GDP growth, per capita income growth and labour productivity growth are often used interchangeably. However, the large differences across countries in terms of rates of population growth and labour force growth imply that the relationships between these three concepts are in fact complex and country-specific. Indeed, some EBRD regions have similar rates of real output growth, despite differing considerably in terms of growth in per capita income and the underlying growth in output per worker.
Introduction
The first part of this Macroeconomic Overview provides a brief summary of economic developments in the EBRD regions in 2017 and the first half of 2018.1 (For the most up-to-date information on economic performance in those regions, see the latest issue of Regional Economic Prospects in the EBRD Regions.) With the longer-term growth trajectories of countries where the EBRD invests being largely shaped by their demographic profiles, the second part of this overview then looks at the average economic performance of the EBRD regions and other countries around the world in relation to basic demographic variables.
Strong growth momentum
Growth in the first quarter of 2018 was the strongest seen since mid-2012
Economic growth in the EBRD regions averaged 3.8 per cent in 2017 (weighted on the basis of countries’ gross domestic product (GDP) at purchasing power parity (PPP)), up from 1.9 per cent in 2016. In the first half of 2018 growth moderated somewhat overall in year-on-year terms, but remained relatively strong. Indeed, it stood at 4 per cent in the first quarter of the year on a 12-month rolling basis – the strongest rate seen since the second quarter of 2012 (albeit it remained some way short of the levels observed in the middle of the last decade, when growth rates of 6 to 8 per cent were recorded; see Chart M.1).
Foreign direct investment flows remain broadly stable
Gross inward foreign direct investment (FDI) in the median EBRD economy totalled 2.8 per cent of GDP in the 12 months to March 2018 – broadly equivalent to the levels observed in emerging Asia, but somewhat below those seen in Latin America. Levels of FDI have remained broadly stable over the last five years, with the increase in investment in the EBRD regions being accounted for primarily by domestic sources, as well as greater use of EU structural and cohesion funds in central and south eastern Europe. At a global level, FDI flows have exhibited a slight downward trend, partly reflecting growing hostility to globalisation and trade tensions. Diminishing returns to technological advances in telecommunications and transport – which are typically leveraged by multinational companies participating in global value chains – may also be having an impact.
Favourable financing conditions
As a result of the global search for yield, financing conditions in emerging markets have remained favourable, despite the US Federal Reserve continuing to gradually raise its policy rate. Although global stock markets experienced a correction in February 2018, followed by a period of somewhat higher volatility, equity prices in emerging Europe were, on average, 8 per cent higher in October 2018 in US dollar terms than they had been three years earlier. Russian stocks experienced a larger downward correction following the announcement of a new round of US sanctions in April 2018, with affected firms including Rusal, a major aluminium producer. Yields on emerging market bonds were not greatly affected by the increase in stock market volatility.
Increases in average oil prices
The price of Brent crude oil briefly exceeded US$ 70 per barrel in January 2018, and then again in April 2018, on account of strengthening demand, cuts to production by Russia and members of the Organization of Petroleum Exporting Countries (OPEC), and concerns about disruptions to supply. As a result, the average oil price in the period from January to July 2018 was 31 per cent higher than it had been in the equivalent period in 2017, following a 24 per cent increase the previous year. So far, those higher prices have more than offset the impact of smaller production volumes for Russia and other exporters that have committed to production caps. The adverse impact on commodity importers has been limited, as global consumption of oil tends to be spread fairly evenly across countries, while global production is concentrated in a relatively small number of major oil exporters.
Growth momentum broadly based across the EBRD regions
Growth in central Europe and the Baltic states (CEB) has picked up strongly, averaging 4.3 per cent in 2017 (up from 2.9 per cent in 2016) and 4.7 per cent year on year in the first half of 2018, boosted by increases in investment and stronger wage growth. Similarly, growth in south-eastern Europe (SEE) averaged 4.1 per cent in 2017, up from 3 per cent in 2016, before moderating somewhat to stand at 3.4 per cent year on year in the first half of 2018. In particular, Romania’s growth rate was close to 7 per cent in 2017, well above its estimated long-term growth potential, on the back of an expansionary fiscal policy and rising wages, before falling back to stand at 4 per cent year on year in the first half of 2018. Greece, meanwhile, saw modest levels of positive GDP growth in 2017, after two years of marginally negative growth rates.
Wage growth picks up as labour markets tighten
As the economic recovery has taken hold, labour markets have gradually tightened. Across the EBRD regions, unemployment rates have declined from their peaks, but they remain elevated in many countries, with average unemployment rates ranging from 4 per cent in central Europe to 11 per cent in the SEE region (weighted by population). As labour markets have tightened, wage growth has picked up, particularly in countries with declining labour forces (such as Bulgaria, Latvia, Lithuania, Romania and Slovenia). That stronger wage growth has, in turn, boosted domestic demand, contributing to the stronger-than-expected economic performance in 2017.
Limited impact on inflation so far
Those falling unemployment rates have not yet resulted in strong inflationary pressures, mirroring trends in advanced economies.4 In part, this may reflect the existence of substantial economic slack following a prolonged period of modest economic growth after the 2008-09 global financial crisis.5 Technological change may further weaken the link between unemployment and wage growth. Technology makes it easier for workers to be matched with job openings or to be employed part time on a freelance basis in the “gig economy”, reducing the structural rate of unemployment. In addition, there are many occupations where the risk of automation may be limiting workers’ ability or willingness to seek pay rises, even as labour markets become tighter.6
Persistently high inflation in several countries
In several countries, however, inflation has been high and rising. In Turkey, an expansionary fiscal policy and measures to increase the supply of credit and raise economic growth above its long-term potential have resulted in an overheating economy and contributed to persistent double-digit inflation. In Egypt, Ukraine and Uzbekistan, meanwhile, high inflation rates are a legacy of earlier sharp depreciations in those countries’ currencies. In Egypt, inflation stood at 14 per cent in June 2018, down from an average of 30 per cent in 2017. In Ukraine, inflation stood at just under 10 per cent in June 2018, following repeated increases in the National Bank of Ukraine’s policy rate in 2017 and 2018 with the aim of curbing inflationary pressures. And in Uzbekistan, an inflation rate of just under 20 per cent was recorded in early 2018.
Remittances surpass previous peak in local currency terms
Economic growth in Central Asia, Moldova and the Caucasus was also supported by growth in remittances from Russia turning positive again, with remittance growth in US dollar terms standing at 27 per cent in 2017 and 11 per cent year on year in the first quarter of 2018. While in US dollar terms (at constant US prices) the level of remittances in 2017 was still around 40 per cent below the peak observed in 2013, in real local currency terms (adjusted for local inflation) remittances surpassed that previous peak.
Rise in corporate debt denominated in foreign currencies
Across the EBRD regions, companies and governments alike have been taking advantage of favourable global financing conditions and borrowing in international financial markets, with total non-financial corporate debt in the EBRD regions averaging 63 per cent of GDP in 2017, up from 58 per cent of GDP in 2007. These trends have been broadly based, with significant increases in corporate indebtedness being observed in the median economy.
Much of that recent increase in corporate debt is accounted for by external borrowing or domestic borrowing denominated in foreign currencies, with foreign currency-denominated domestic and external debt accounting for around 79 per cent of the total debt of the non-financial corporate sector in 2017. At the same time, real growth in domestic credit (adjusted for inflation and exchange rate movements) has been moving in line with growth in real output.
Capital flows resilient to date
Such an increase in corporate indebtedness in foreign currency would represent a potential source of vulnerability if global financing conditions tightened rapidly and net capital flows to emerging markets weakened substantially. So far, capital flows to emerging markets have remained broadly resilient. For instance, net mutual fund flows to the EBRD regions in the 12 months to June 2018 equated to around 4 per cent of assets under management, according to data compiled by EPFR Global. The resilience of capital flows has, in part, been supported by the relative weakness of the US dollar, with a weaker dollar making it easier to service debt obligations denominated in that currency and increasing dollar-referenced returns for emerging market investors. Between mid-2017 and mid 2018 the currencies of the EBRD regions remained broadly stable overall, appreciating somewhat against the US dollar and depreciating slightly against the euro.
Progress made in reducing NPLs, but much remains to be done
A combination of policy measures and an economic upswing has led to reductions in the ratio of non-performing loans (NPLs) to total loans, with that ratio declining by almost 10 percentage points relative to the peak observed after the 2008-09 financial crisis in the median economy. That being said, NPL ratios remain in double digits in around a third of all economies where the EBRD invests. Meanwhile, a banking scandal in Latvia in February 2018 highlighted other challenges in terms of the regulation and supervision of banks in the EBRD regions. Following accusations of money laundering and corruption, ABLV, Latvia’s third-largest commercial bank, submitted a voluntary liquidation plan and is expected to be wound up with the assistance of independent international auditors.
All in all, the short-term economic outlook for the EBRD regions has improved. In the longer term, however, those economies’ growth trajectories are, to a large extent, shaped by their demographic profiles. The next section examines the links between the demographic characteristics of countries where the EBRD invests and various economic indicators.
Source: National authorities, International Monetary Fund (IMF) and authors’ calculations.
Note: Each figure relates to a 12-month period. For example, the figure for the first quarter of 2018 indicates average growth over the period from April 2017 to March 2018. The dotted line indicates short-term forecasts based on a principal component model incorporating 152 global economic indicators.
Source: EBRD.
- Emerging Europe
- Other economies in the EBRD regions
- ▲ Advanced economies
- Other
Source: National authorities, IMF, International Labour Organization (ILO) and authors’ calculations.
Note: Figures represent simple averages across the five years in question. GDP per worker is defined as output divided by the number of people in the labour force.
Growth in GDP, per capita income and labour productivity
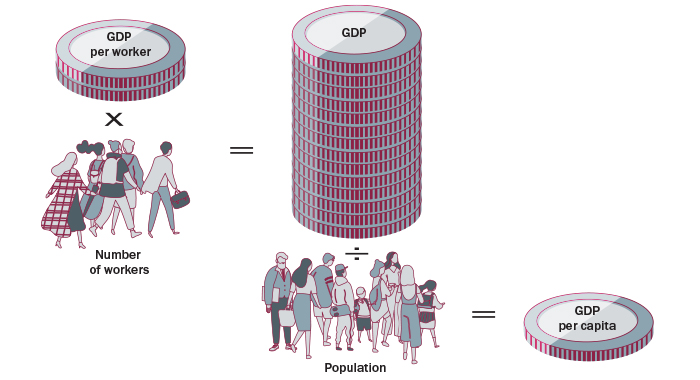
When policymakers and economists discuss economic growth in the short term, they typically focus on headline economic growth – the change in gross value added at constant prices. Over the longer term, however, a more typical metric of economic development is the change in income per capita. And when looking at the challenge of improving growth performance, the focus is often on labour productivity growth, or the change in output per worker – a metric that is also available to individual firms.
Those three metrics – GDP growth, per capita income growth and labour productivity growth – are closely related, but may nonetheless behave differently, depending on a country’s demographics (see Chart M.2).
Growth and labour productivity
At a global level, 89 per cent of all economies have seen their labour force grow in recent years, accounting for 91 per cent of global value added. Notable exceptions include emerging Europe, southern Europe, Thailand and, most recently, China (see the economies sitting on or below the 45 degree line in Chart M.3). In these economies, headline economic growth has fallen short of productivity growth.7 At the level of the EBRD regions, 76 per cent of economies saw their labour force grow in the 2000s, accounting for 81 per cent of total output. However, in the period 2012-17, only 24 economies experienced labour force growth, accounting for 54 per cent of total output.
GDP growth and per capita income growth
Differences in demography also shape the relationship between real GDP growth and growth in real output per capita, which determines the speed at which incomes converge with the levels seen in advanced economies (see Chart M.4). For instance, central European and SEMED economies may average similar rates of GDP growth (around 4 per cent in recent years), but their rates of population growth differ substantially. As a result, annual per capita income growth averages around 2 per cent in the SEMED region, compared with more than 4 per cent in central Europe. In other words, the SEMED region currently requires significantly higher rates of GDP growth in order to create jobs and push per capita incomes towards the levels seen in advanced economies.
Labour productivity growth and per capita incomes: the first demographic dividend
At a given level of labour productivity growth, per capita incomes rise faster in economies where labour force growth is stronger relative to general population growth (see Chart M.5). To see why, imagine a typical EBRD economy with labour productivity growth of around 3 per cent in 2017. If the number of workers rises by 2 per cent a year, while the population rises by 1 per cent, income per capita (productivity times the number of workers, divided by the population) rises by approximately 4 per cent a year. In this scenario, demographics amplify productivity growth and deliver stronger per capita income growth.
Demographic trends constraining medium-term growth potential and convergence
Today, the differential between the growth rate of the labour force and that of the population remains positive in only 64 per cent of economies, accounting for 38 per cent of world GDP. What is more, those percentages have been declining rapidly. In the years preceding the 2008-09 global financial crisis, countries experiencing a demographic dividend accounted for 70 per cent of world GDP. A similar trend can be observed by looking solely at economies that face a greater challenge in terms of per capita income convergence – defined here as countries where GDP per capita remains less than 50 per cent of the level observed in the USA. In the period 2002-07, countries where labour force growth outpaced population growth accounted for 90 per cent of those economies’ contributions to GDP. By 2012-17, however, that figure had dropped to 48 per cent (see Chart M.7).
- Emerging Europe
- Other economies in the EBRD regions
- ▲ Advanced economies
- Other
Source: National authorities, IMF, ILO and authors’ calculations.
Note: Figures represent simple averages across the five years in question.
- Emerging Europe
- Other economies in the EBRD regions
- ▲ Advanced economies
- Other
Source: IMF, ILO and authors’ calculations.
Note: Figures represent simple averages across the five years in question. GDP per worker is defined as output divided by the number of people in the labour force.
- Emerging Europe
- Other economies in the EBRD regions
- ▲ Advanced economies
- Other
Source: IMF, ILO and authors’ calculations.
Note: Figures represent simple averages across the five years in question. GDP per worker is defined as output divided by the number of people in the labour force.
Source: UN, IMF and authors’ calculations.
Note: Shares of GDP are based on GDP at PPP. Emerging markets are defined as economies where GDP per capita remains less than 50 per cent of the US level, measured at market exchange rates.
Source: IMF, ILO, UN and authors’ calculations.
Note: For the period 2002-07, figures represent simple averages across the five years in question. Projections are based on the median scenario.
- Emerging Europe
- Other economies in the EBRD regions
- ▲ Advanced economies
- Other
Source: IMF, ILO and authors’ calculations.
Note: Figures represent simple averages across the five years in question.
Conclusion
Following several years of relatively weak economic performance, growth in the EBRD regions averaged 3.8 per cent in 2017 – the second successive year of strengthening growth. That growth was broadly-based, with support provided by stronger investment activity and increases in exports.
In the longer term, the growth trajectories of economies where the EBRD invests are, to a large extent, shaped by those countries’ demographic profiles. In particular, economies in the EBRD region have very different rates of population growth and labour force growth, implying that the relationships between productivity growth, per capita income growth and headline economic growth – three concepts that are often used interchangeably – are in fact somewhat complex and country-specific. For instance, while central European and SEMED economies are currently averaging similar rates of real output growth, central European economies are, on average, enjoying higher rates of per capita income growth.
In the future, both population growth and labour force growth are projected to weaken in the EBRD regions. The slow-down in labour force growth is projected to be more rapid on average, resulting in a diminishing first demographic dividend. This, in turn, will mean weaker growth in per capita income, unless labour productivity growth picks up.
The remainder of this report looks at other ways in which the demographic transformation helps to shape growth and the ways in which it interacts with technological change and migration patterns.
References
D. Acemoğlu and P. Restrepo (2018)
“Demographics and Automation”, NBER Working Paper No. 24421.
D. Bloom, D. Canning and J. Sevilla (2003)
“The demographic dividend: A new perspective on the economic consequences of population change”, RAND Monograph MR 1274.
D. Bloom and J. Williamson (1998)
“Demographic Transitions and Economic Miracles in Emerging Asia”, The World Bank Economic Review, Vol. 12, pp. 419-456.
E. Boz, G. Gopinath and M. Plagborg-Møller (2017)
“Global Trade and the Dollar”, IMF Working Paper No. 17/239.
EBRD (2017)
Transition Report 2017-18 – Sustaining Growth, London.
O. Galor and A. Mountford (2008)
“Trading Population for Productivity: Theory and Evidence”, The Review of Economic Studies, Vol. 75, pp. 1143-1179.
IDB, AfDB, ADB and EBRD (2018)
The Future of Work: Regional Perspectives, Washington, DC.
IMF (2018)
World Economic Outlook, October.
M. McLeay and S. Tenreyro (2018)
“Optimal Inflation and the Identification of the Phillips Curve”, CEPR Discussion Paper No. 12981.
A.W. Phillips (1958)
“The Relation between Unemployment and the Rate of Change of Money Wage Rates in the United Kingdom 1861-1957”, Economica, Vol. 25, pp. 283-299.
Subscribe to the EBRD Transition Report 2018-19 mailing list.
Sign up to receive important announcements and emails about the Transition Report.