
International migration
Emigration rates in the EBRD regions have been rising since 1990. Single, male, young and highly educated individuals from urban areas are more likely to migrate than their peers. Low satisfaction with the quality of local amenities (such as air and water, education, healthcare, housing, and roads and transport) is strongly associated with intentions to migrate. Many countries in these regions also serve as transit and/or host countries for refugees and irregular migrants from other parts of the world, who tend to be single, male, young and reasonably well educated (relative to the average level in their country of origin). Well educated refugees and irregular migrants often select their intended country of destination with a view to maximising the return on their skills, while those with lower levels of education are more likely to head for countries that have better integration policies and faster asylum processes.
Introduction
The total number of international migrants around the world – a figure that includes both voluntary migration and forced displacement – has continued to grow rapidly. It reached 258 million in 2017, up from 153 million in 1990, according to figures compiled by the United Nations Department of Economic and Social Affairs (UN DESA).1 People residing in a country where they were not born, or of which they do not hold citizenship, totalled 3.4 per cent of the world’s population in 2017, up from 2.9 per cent in 1990. Most of those people are economic migrants – people who have travelled abroad voluntarily in search of economic opportunities. Such migration can be short-term, long-term or circular (see Box 3.1 for a discussion of circular migration).
Migration trends in the EBRD regions
Emigration
What do we know about the geography of migration in the EBRD regions? Russia and Ukraine are both in the top 10 economies of origin worldwide in terms of absolute numbers of migrants (see Chart 3.1), with Russia ranked third, after India and Mexico. The West Bank and Gaza have the highest rate of emigration in the EBRD regions (and the 10th highest in the world) as a percentage of total population, with their 3.8 million emigrants equating to 82 per cent of the remaining local population.
Immigration
Russia is ranked fourth worldwide in terms of absolute numbers of immigrants, after the USA, Saudi Arabia and Germany (see Chart 3.3), with more than 11 million foreign-born individuals or foreign citizens living in the country. Jordan and Lebanon have the highest numbers of immigrants in the EBRD regions as a percentage of their local populations.
- Number of emigrants living abroad (left-hand axis)
- Emigrants living abroad as a percentage of the remaining local population (right-hand axis)
Source: UN DESA (2017a) and authors’ calculations.
Note: Data relate to 2017. “Emigrants” are defined here as people who are no longer living in their economy of birth or citizenship. The numbers in parentheses indicate the position of each economy in the global rankings in terms of the absolute number of emigrants and emigrants as a percentage of the remaining local population respectively. The dark green bars and diamonds indicate the top 10 economies in absolute and percentage terms respectively.
- Number of migrants from EBRD regions living in country (left-hand axis)
- Migrants from EBRD regions as a percentage of the local population in the country of destination (right-hand axis)
Source: UN DESA (2017a) and authors’ calculations.
Note: Data relate to 2017. “Migrants” are defined here as people who are no longer living in their economy of birth or citizenship. The dark green bars and diamonds indicate the top 10 economies in absolute and percentage terms respectively.
- Number of immigrants (left-hand axis)
- Immigrants as a percentage of the local population (right-hand axis)
Source: UN DESA (2017a) and authors’ calculations.
Note: Data relate to 2017. “Immigrants” are defined here as people who are no longer living in their economy of birth or citizenship. The numbers in parentheses indicate the position of each economy in the global rankings in terms of the absolute number of immigrants and immigrants as a percentage of the local population respectively. The dark green bars and diamonds indicate the top 10 economies in absolute and percentage terms respectively.
Potential migrants: in search of more than just wages?
As regards the factors shaping migration decisions, previous studies have highlighted the roles played by (i) income differentials between countries of origin and destination, (ii) the corresponding differences in unemployment levels between countries of origin and destination, (iii) the cost of migration and (iv) the presence of migrant networks abroad.4 Less attention, however, has been devoted to understanding how the quality of life and the quality of amenities in the home country may be linked to decisions to move abroad. This section looks at the profile of a typical migrant and compares monetary and non-monetary incentives to leave one’s home country.
Data and methodology
The analysis in this section is based on data from the Gallup World Poll – a comprehensive annual survey completed by people living in more than 160 economies around the world (including all economies in the EBRD regions). The survey collects information on people’s demographic and socio-economic characteristics, as well as their attitudes. Crucially, between 2010 and 2015 respondents were also asked about their satisfaction with a range of amenities – air and water, education, healthcare, housing, and roads and transport. They were also asked whether they would ideally like to move permanently to another country if they had the opportunity and whether they intended to migrate in the next 12 months. Other questions concerned people’s preferred countries of destination and any social networks they had at home and abroad. Given that the survey mainly covers non-conflict areas, respondents can predominantly be thought of as potential economic migrants.9
Intentions to migrate on the rise
Intentions to migrate rose around the world between 2010 and 2015 (see Chart 3.4). In the EBRD regions, more than 3 per cent of respondents indicated an intention to migrate in 2015, compared with 1.8 per cent in 2010. A similar trend was observed in countries with comparable levels of income, with 3.9 per cent of respondents in those economies reporting an intention to migrate in 2015, up from 2.5 per cent in 2010. In absolute terms, those figures suggest that around 20 million people in the EBRD regions may have been considering a move abroad in 2015.
The profile of potential migrants
Across the world, young men from urban areas are more likely to report an intention to migrate (see columns 1-3 of Table 3.1). These results also apply to potential migrants from the EBRD regions and comparator economies (see columns 4 and 5 of Table 3.1), and are confirmed when a similar analysis is undertaken on a subset of economies in central and south-eastern Europe using a different dataset (see Box 3.3). Married individuals are less likely to want to migrate, while having children has a positive effect on intentions to migrate but is only marginally statistically significant. People who have completed secondary education are more likely to migrate than their less-educated counterparts.
People who intend to migrate report lower levels of satisfaction with amenities
On average, satisfaction with the quality of air and water, education, healthcare, housing, and roads and transport remained broadly stable in the EBRD regions over the period 2010-15, standing at around 0.54 on a scale of 0 to 1 in 2015 (see Chart 3.6). However, that average masks substantial variation across individual regions. In the SEMED region, for example, average satisfaction with amenities declined by 20 per cent between 2010 and 2015, while satisfaction levels in Turkey fell by 5 per cent. In Central Asia and the EEC region, by contrast, average satisfaction with amenities improved by around 9 per cent over that period.
Source: Gallup World Poll and authors’ calculations.
Note: This chart reports the percentage of respondents who indicated that they wanted to move to another country on a permanent basis and were planning to do so within the next 12 months. The comparator economies used for this purpose are those with GDP per capita (at PPP) between the minimum and maximum values observed in the EBRD regions.
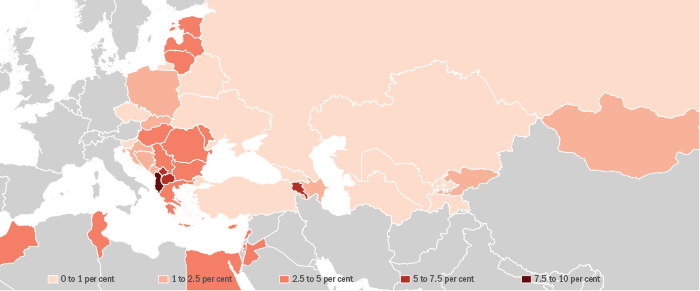
Source: Gallup World Poll and authors’ calculations.
Note: This map reports the percentage of respondents who indicated that they wanted to move to another country on a permanent basis and were planning to do so within the next 12 months. Data represent six-year survey-weighted averages. The last four intervals in the legend are half-open: they include the upper endpoints but not the lower endpoints.
| Dependent variable | Intention to migrate (0/100) | |||||
|---|---|---|---|---|---|---|
| Global sample | Economies in the EBRD regions | Comparator economies | ||||
| (1) | (2) | (3) | (4) | (5) | ||
| Demographic characteristics | Male | 1.11*** | 0.89*** | 0.90*** | 1.11*** | 0.74*** |
| (0.05) | (0.07) | (0.09) | (0.16) | (0.12) | ||
| Aged 18-24 | 2.89*** | 3.61*** | 3.98*** | 5.71*** | 2.93*** | |
| (0.10) | (0.12) | (0.15) | (0.35) | (0.20) | ||
| Aged 25-64 | 1.78*** | 2.34*** | 2.52*** | 2.96*** | 2.02*** | |
| (0.06) | (0.08) | (0.10) | (0.17) | (0.13) | ||
| Married or in partnership | -1.55*** | -1.60*** | -1.64*** | -1.88*** | -1.30*** | |
| (0.06) | (0.08) | (0.10) | (0.18) | (0.13) | ||
| Has children below age of 15 | 0.10* | -0.02 | 0.19** | 0.44** | 0.03 | |
| (0.06) | (0.07) | (0.09) | (0.17) | (0.12) | ||
| Living in urban area | 1.06*** | 1.20*** | 1.15*** | 1.02*** | 1.06*** | |
| (0.06) | (0.08) | (0.10) | (0.18) | (0.13) | ||
| Education and labour market outcomes | No education or only primary education | -1.15*** | -0.51*** | -0.47*** | 0.08 | -0.54*** |
| (0.06) | (0.09) | (0.11) | (0.23) | (0.13) | ||
| Tertiary education | 1.06*** | 0.34** | 0.31 | 0.84*** | 0.33 | |
| (0.12) | (0.17) | (0.21) | (0.31) | (0.33) | ||
| Full-time employment | -0.13* | 0.05 | -0.00 | -0.51** | 0.17 | |
| (0.07) | (0.09) | (0.12) | (0.21) | (0.15) | ||
| Full-time employment and tertiary education | -0.75*** | -0.94*** | -0.95*** | -0.81* | -0.72 | |
| (0.16) | (0.24) | (0.29) | (0.42) | (0.47) | ||
| Wage differential and cost of migration from country of origin to country of destination | Wage differential (log) | 1.26*** | 1.28*** | 0.76*** | 1.05*** | |
| (0.06) | (0.07) | (0.11) | (0.10) | |||
| Common border | 2.04* | 1.29 | -6.10** | 3.60 | ||
| (1.10) | (1.41) | (2.71) | (2.19) | |||
| Distance between most populous cities (log) | -1.46*** | -1.40*** | -0.23 | 0.07 | ||
| (0.40) | (0.52) | (0.75) | (0.82) | |||
| Once part of same country | -1.39 | -1.64 | -2.90 | -5.90** | ||
| (1.52) | (1.86) | (3.59) | (2.57) | |||
| Once in colonial relationship | 1.74** | 1.42 | 15.94*** | -0.37 | ||
| (0.79) | (1.12) | (2.54) | (1.84) | |||
| Linguistic proximity | -0.60* | -0.37 | 0.74 | -1.03** | ||
| (0.32) | (0.43) | (1.40) | (0.52) | |||
| Respondent has network abroad | 3.71*** | 4.07*** | 4.15*** | 3.81*** | ||
| (0.08) | (0.10) | (0.18) | (0.14) | |||
| Respondent has network at home | -0.86*** | -0.84*** | -0.74*** | -0.76*** | ||
| (0.08) | (0.11) | (0.20) | (0.14) | |||
| Attitudes and perceptions | Personal safety | -0.84*** | -0.60*** | -0.72*** | ||
| (0.09) | (0.17) | (0.12) | ||||
| Life satisfaction | -0.02 | -0.23*** | -0.00 | |||
| (0.02) | (0.05) | (0.03) | ||||
| Trust in the national government | -1.17*** | -1.20*** | -1.10*** | |||
| (0.09) | (0.17) | (0.12) | ||||
| Corruption widespread in business | 0.34*** | 0.77*** | 0.12 | |||
| (0.13) | (0.25) | (0.17) | ||||
| Corruption widespread in government | 0.15 | -0.00 | -0.09 | |||
| (0.13) | (0.26) | (0.17) | ||||
| Number of observations | 774,175 | 469,670 | 325,004 | 77,375 | 166,251 | |
| R2 | 0.03 | 0.05 | 0.05 | 0.05 | 0.04 | |
SOURCE: Gallup World Poll, CEPII database and authors’ calculations.
NOTE: Estimated using a linear probability model with survey-weighted observations. Robust standard errors are reported in parentheses, and *, ** and *** denote values that are statistically significant at the 10, 5 and 1 per cent levels respectively. Columns 1-3 report results for all economies included in the Gallup World Poll, while columns 4 and 5 show results for economies in the EBRD regions and for economies with comparable income levels only. All specifications take account of demographic characteristics, education and labour market outcomes, country of origin fixed effects and survey year fixed effects. Specifications in columns 2-5 also control for the wage differential and the cost of migration from the country of origin to the country of destination, whereas specifications in columns 3-5 include variables that capture the respondent’s attitudes and perceptions. The results are robust to the inclusion of country of destination fixed effects. The comparator economies used for this purpose are those with GDP per capita (at PPP) between the minimum and maximum values observed in the EBRD regions.
Source: Gallup World Poll and authors’ calculations.
Note: The comparator economies used for this purpose are those with GDP per capita (at PPP) between the minimum and maximum values observed in the EBRD regions.
Source: Gallup World Poll and authors’ calculations.
Note: Estimates calculated on the basis of regression analysis controlling for demographic characteristics, education and labour market outcomes, country of origin fixed effects and survey year fixed effects, using survey-weighted observations. The comparator economies used for this purpose are those with GDP per capita (at PPP) between the minimum and maximum values observed in the EBRD regions.
Source: Gallup World Poll, CEPII database and authors’ calculations.
Note: These estimates of the impact that changes in satisfaction with amenities have on intentions to migrate have been obtained using a linear probability model. The specification controls for country of origin fixed effects and survey year fixed effects, demographic characteristics of the respondent, education and labour market outcomes, the wage differential and the cost of migration from the country of origin to the country of destination, as well as variables capturing the respondent’s attitudes and perceptions. The regression also includes interaction terms between each of the amenity variables and a dummy variable identifying economies in the EBRD regions. Robust standard errors have been used to construct the 95 per cent confidence intervals shown.
Refugees and irregular migrants from other parts of the world
At the end of 2017, there were 68.5 million forcibly displaced persons worldwide. The total number of people seeking sanctuary in a foreign country as a refugee stood at 20 million, with more than half of all refugees coming from Afghanistan, South Sudan and Syria.11 The present refugee crisis differs from that of the 1990s in three crucial respects. First, it has had a much stronger impact on politics in Europe on the back of the rise of populist parties and the increase in economic hardship that was brought about by the financial crisis of 2008-09 and the subsequent eurozone debt crisis. Second, the current crisis involves multiple actors, over which Western nations have much less influence than they did in the 1990s. Third, the refugees arriving in Europe are regarded by many as being more culturally distant than those of the previous wave.12
Many economies in the EBRD regions act as transit points for refugees and irregular migrants
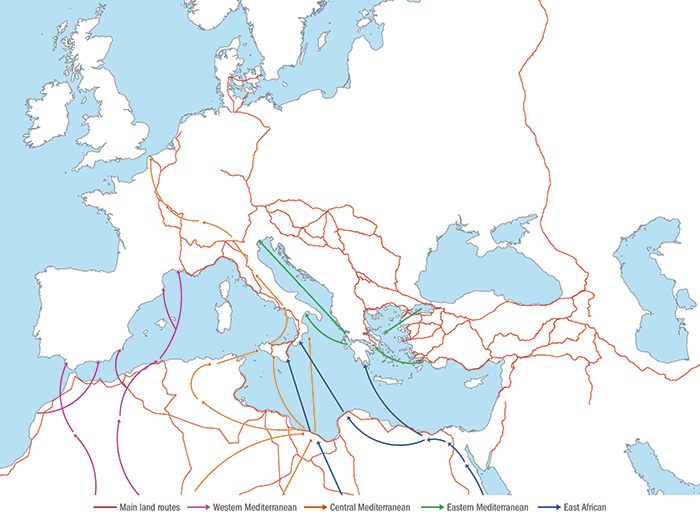
Many economies in the EBRD regions host refugees and irregular migrants in transit. In particular, from 2015 the Western Balkans migration route – formally “closed”, as announced by the EU in March 2016 – saw sharp increases in the numbers of people on the move. This was a key route for migrants who entered the European Union via Bulgaria and Greece – travelling via Turkey by both land and sea – with the aim of reaching various countries in the Schengen area (see Chart 3.9).
Where do refugees and irregular migrants come from?
Refugees and irregular migrants predominantly originate from low or lower-middle-income countries. Indeed, Syria, Afghanistan and Iraq account for 55 per cent of all respondents interviewed by the IOM as part of its FMS surveys (see Chart 3.11). The overwhelming majority of respondents are male (83 per cent) and single (70 per cent), with an average age of 26. Around half of the respondents report having been employed before migrating, with 17 per cent being educated to tertiary level.
Socio-demographic characteristics of refugees and irregular migrants
Regression analysis indicates that people who are educated to secondary or tertiary level are significantly more likely to migrate than people with lower levels of education, particularly when people are fleeing a major conflict (see columns 1 and 2 of Table 3.3). In countries with only a minor conflict or no conflict at all (see column 3), education plays less of a role (and only tertiary education remains a statistically significant predictor of becoming a migrant). Thus, refugees and irregular migrants escaping major conflicts tend to be highly educated relative to the national average in their country of origin, possibly because better-educated individuals will be in a better position to finance their trip, while liquidity constraints and immigration restrictions will prevent the poorest people from migrating.13 Full details of this regression analysis can be found in Annex 3.3.
| Dependent variable | Intention to migrate (0/100) | ||||||
|---|---|---|---|---|---|---|---|
| (1) | (2) | (3) | (4) | (5) | (6) | ||
| Satisfaction index | -1.90*** | -1.99*** | -1.58*** | ||||
| (0.09) | (0.11) | (0.14) | |||||
| Satisfied with: | Air and water | -0.53*** | -0.47*** | -0.36*** | |||
| (0.07) | (0.08) | (0.10) | |||||
| Education | -0.68*** | -0.67*** | -0.50*** | ||||
| (0.07) | (0.09) | (0.11) | |||||
| Healthcare | -0.21*** | -0.23*** | -0.21** | ||||
| (0.07) | (0.09) | (0.10) | |||||
| Housing | -0.35*** | -0.47*** | -0.42*** | ||||
| (0.06) | (0.08) | (0.10) | |||||
| Roads and transport | -0.29*** | -0.27*** | -0.09 | ||||
| (0.06) | (0.08) | (0.10) | |||||
| Wage differential (log) | 1.24*** | 1.28*** | 1.33*** | 1.33*** | |||
| (0.06) | (0.07) | (0.06) | (0.07) | ||||
| Number of observations | 755,121 | 462,339 | 324,733 | 594,064 | 378,739 | 281,227 | |
| R2 | 0.03 | 0.05 | 0.05 | 0.04 | 0.05 | 0.05 | |
| Wage differential and cost of migration from country of origin to country of destination | No | Yes | Yes | No | Yes | Yes | |
| Attitudes and perceptions | No | No | Yes | No | No | Yes | |
SOURCE: Gallup World Poll, CEPII database and authors’ calculations
NOTE: Estimated on the basis of a global sample using a linear probability model with survey-weighted observations. Robust standard errors are reported in parentheses, and *, ** and *** denote values that are statistically significant at the 10, 5 and 1 per cent levels respectively. All specifications take account of demographic characteristics, education and labour market outcomes, country of origin fixed effects and survey year fixed effects. Specifications in columns 2, 3, 5 and 6 also control for the wage differential and the cost of migration from the country of origin to the country of destination, whereas specifications in columns 3 and 6 include variables that capture the respondent’s attitudes and perceptions. The results are robust to the inclusion of country of destination fixed effects.
Source: IOM and authors’ calculations.
Source: FMS (2015-16) and authors’ calculations.
Source: FMS (2015-16) and authors’ calculations.
Source: FMS (2015-16) and authors’ calculations.
Source: FMS (2015-16) and authors’ calculations.
| (1) | (2) | (3) | |
|---|---|---|---|
| All | Major conflict | Minor/no conflict | |
| Secondary education | 0.038*** | 0.053*** | 0.000 |
| (0.003) | (0.004) | (0.004) | |
| Tertiary education | 0.050*** | 0.065*** | 0.015** |
| (0.005) | (0.007) | (0.006) | |
| Employed | 0.007*** | 0.009*** | 0.006 |
| (0.003) | (0.003) | (0.004) | |
| Male | 0.054*** | 0.057*** | 0.046*** |
| (0.002) | (0.003) | (0.004) | |
| Aged 25-34 | 0.081*** | 0.092*** | 0.070*** |
| (0.003) | (0.004) | (0.004) | |
| Aged 35-44 | 0.041*** | 0.054*** | 0.021*** |
| (0.003) | (0.004) | (0.003) | |
| Aged 45-54 | 0.013*** | 0.021*** | 0.005** |
| (0.002) | (0.004) | (0.002) | |
| Married | -0.031*** | -0.030*** | -0.038*** |
| (0.004) | (0.005) | (0.006) | |
| Country fixed effects | Yes | Yes | Yes |
| R2 | 0.203 | 0.227 | 0.058 |
| Number of observations | 44,272 | 29,794 | 14,478 |
SOURCE: FMS (2015-16) and Gallup World Poll (2009-14).
NOTE: Robust standard errors are reported in parentheses, and *, ** and *** denote values that are statistically significant at the 10, 5 and 1 per cent levels respectively. Data relate to people from the following nine countries: Afghanistan, Algeria, Iran, Iraq, Libya, Morocco, Nigeria, Pakistan and Syria. The dependent variable is equal to 1 for refugees and irregular migrants in the FMS data and 0 for participants in Gallup World Polls. Reference categories are as follows: education below secondary level, unemployed or out of labour force, female, aged 54+, and single. All specifications include dummies for widowed and divorced, although these are not reported above. A “major conflict” is defined as a country with 1,000 or more conflict-related deaths in any of the years in question.
| (1) | (2) | (3) | |
|---|---|---|---|
| All | Major conflict | Minor/no conflict | |
| Men and women | |||
| Log of estimated income | 0.113*** | 0.137*** | 0.069*** |
| (0.006) | (0.007) | (0.008) | |
| R2 | 0.174 | 0.198 | 0.011 |
| Number of observations | 44,272 | 29,794 | 14,478 |
| Men | |||
| Log of estimated income | 0.150*** | 0.172*** | 0.106*** |
| (0.008) | (0.011) | (0.013) | |
| R2 | 0.192 | 0.219 | 0.014 |
| Number of observations | 23,665 | 16,448 | 7,217 |
| Women | |||
| Log of estimated income | 0.048*** | 0.058*** | 0.032*** |
| (0.006) | (0.007) | (0.008) | |
| R2 | 0.110 | 0.123 | 0.010 |
| Number of observations | 20,607 | 13,346 | 7,261 |
SOURCE: FMS (2015-16) and Gallup World Poll (2009-14).
NOTE: Robust standard errors are reported in parentheses, and *, ** and *** denote values that are statistically significant at the 10, 5 and 1 per cent levels respectively. Data relate to people from the following nine countries: Afghanistan, Algeria, Iran, Iraq, Libya, Morocco, Nigeria, Pakistan and Syria. The dependent variable is equal to 1 for refugees and irregular migrants in the FMS data and 0 for participants in Gallup World Polls. All specifications take account of country fixed effects. A “major conflict” is defined as a country with 1,000 or more conflict-related deaths in any of the years in question.
| (1) | (2) | -3 | |
|---|---|---|---|
| All | Major conflict | Minor/no conflict | |
| Secondary education | 0.021*** | 0.018*** | 0.032** |
| (0.006) | (0.006) | (0.014) | |
| Tertiary education | 0.024*** | 0.011 | 0.048** |
| (0.009) | (0.009) | (0.021) | |
| Employed | 0.002 | -0.012 | 0.038*** |
| (0.006) | (0.007) | (0.012) | |
| Male | -0.011 | -0.006 | -0.009 |
| (0.009) | (0.009) | (0.022) | |
| Aged 25-34 | -0.018 | -0.04 | 0.151*** |
| (0.037) | (0.04) | (0.021) | |
| Aged 35-44 | -0.025 | -0.033 | 0.106*** |
| (0.037) | (0.04) | (0.025) | |
| Aged 45-54 | 0.000 | -0.024 | 0.217*** |
| (0.038) | (0.041) | (0.059) | |
| Widowed | 0.017 | 0.023 | 0.002 |
| (0.032) | (0.036) | (0.061) | |
| Married | 0.006 | 0.000 | 0.023 |
| (0.007) | (0.007) | (0.015) | |
| Divorced | 0.01 | 0.024 | 0.014 |
| (0.022) | (0.032) | (0.031) | |
| R2 | 0.241 | 0.243 | 0.246 |
| Number of observations | 3,429 | 2,478 | 951 |
SOURCE: FMS (2015-16) and Gallup World Poll (2009-14).
NOTE: Robust standard errors are reported in parentheses, and *, ** and *** denote values that are statistically significant at the 10, 5 and 1 per cent levels respectively. The dependent variable is the return to education in the intended country of destination (as calculated on the basis of Gallup World Poll data). Reference categories are as follows: less than secondary education, unemployed or out of labour force, female, age 54+, and single. A “major conflict” is defined as a country with 1,000 or more conflict-related deaths in any of the years in question.
| (1) | (2) | (3) | (4) | (5) | |
|---|---|---|---|---|---|
| Outcome variable | Log of unemployment rate in destination country | MIPEX (0-100) | Average duration of asylum procedure (0-1) | Waiting time before accessing labour market (0-1) | Social expenditure (as a percentage of GDP) |
| Primary education | -0.092*** | 0.844*** | -0.035*** | -0.072*** | 0.687*** |
| (0.019) | (0.27) | (0.007) | (0.014) | (0.14) | |
| Secondary education | -0.084*** | 0.841*** | -0.011*** | -0.051*** | 0.723*** |
| (0.018) | (0.265) | (0.003) | (0.013) | (0.137) | |
| Employed | 0.024* | 0.020 | 0.002 | 0.004 | -0.136 |
| (0.015) | (0.189) | (0.005) | (0.009) | (0.103) | |
| Male | 0.042** | -0.774*** | -0.020*** | -0.005 | 0.384*** |
| (0.017) | (0.27) | (0.007) | (0.012) | (0.132) | |
| Aged 25-34 | 0.075* | -0.311 | 0.007 | 0.043 | 0.437 |
| (0.044) | (1.145) | (0.03) | (0.044) | (0.369) | |
| Aged 35-44 | 0.005 | 0.460 | -0.002 | 0.011 | 0.290 |
| (0.045) | (1.152) | (0.03) | (0.044) | (0.37) | |
| Aged 45-54 | -0.031 | 0.357 | 0.010 | -0.008 | -0.314 |
| (0.05) | (1.217) | (0.031) | (0.044) | (0.393) | |
| Married | -0.012 | 0.637*** | -0.001 | -0.016* | 0.068 |
| (0.014) | (0.19) | (0.005) | (0.009) | (0.104) | |
| R2 | 0.302 | 0.053 | 0.192 | 0.076 | 0.353 |
| Number of observations | 3,492 | 3,509 | 3,484 | 3,509 | 3,423 |
SOURCE: Eurofound, FMS (2015-16), MIPEX, OECD, World Bank and authors’ calculations.
NOTE: Robust standard errors are reported in parentheses, and *, ** and *** denote values that are statistically significant at the 10, 5 and 1 per cent levels respectively. At least 100 nationals have been surveyed for each country included in this analysis. All specifications include survey country fixed effects. Reference categories are as follows: more than secondary education, unemployed or out of labour force, female, age 54+, and single. All specifications include widowed and divorced dummies, though not reported above.
Conclusion
International migration is on the rise, both globally and in the EBRD regions. Emigration rates in the EBRD regions have risen since 1990, with almost 10 per cent of people born there now living outside their country of birth or citizenship. Many economies in the EBRD regions have also become major destinations for migrants or important transit countries on migration routes.
The emigration of workers is a concern for many countries, particularly in central and eastern Europe. People who express an intention to migrate tend to be single, male and young and live in cities. They also tend to be better educated than the average person. Many of those people also believe that corruption is widespread in the local business sector and they are often dissatisfied with local amenities such as healthcare, education, air and water, housing, and roads and transport. Satisfaction with the local education system is particularly important for the young and the highly educated when it comes to deciding whether to move abroad.
These findings suggest that improving the business environment and the quality of public services may significantly reduce people’s desire to emigrate. Indeed, increasing satisfaction with local amenities can have the same impact in terms of lowering intentions to migrate as closing 70 per cent of the wage gap between the country of origin and the country of destination. At the same time, the impact of wage increases in the economy of origin is not straightforward: at lower levels of economic development, rising wages can actually increase emigration, as low-skilled workers find it easier to afford the cost of migration. Moreover, the findings presented in Chapter 2 suggest that emigration by skilled workers results in a decline in total factor productivity for firms in countries of origin, but emigrants do send back knowledge, thereby helping those countries to boost innovation and move towards the technological frontier.
In order to minimise the costs of emigration and maximise the associated gains, governments can work with firms to establish training programmes so as to foster skills that are widely sought after in their domestic labour markets. Policies aimed at attracting highly qualified migrants can also help to address specific labour market shortages in the short term. The EU’s Blue Card initiative is a good example of this kind of approach.15
Many economies in the EBRD regions also serve as transit and/or host countries for refugees and irregular migrants from other parts of the world, many of whom are likely to seek asylum. Like economic migrants from the EBRD regions, these people tend to be single, male, young and reasonably well educated (relative to the average level in their country of origin). It appears that they often select their intended country of destination with a view to maximising the return on their skills – typically the only assets they possess. Refugees and irregular migrants who are educated to primary and secondary level are more likely to head for countries with lower unemployment rates, better migrant integration policies, faster asylum processes, easier access to the labour market for people who have successfully claimed asylum, and stronger social safety nets.
While the vast majority of refugees and irregular migrants leave their country in order to escape conflict, the main motivation of a significant number of migrants from countries such as Algeria, Egypt, Morocco and Pakistan is a desire to seek out better economic opportunities abroad. While many of these migrants may ultimately be denied asylum, they can slow down asylum application procedures. This may, in turn, undermine popular support for a well-managed and fair asylum system.16 Ageing European economies – including some countries where the EBRD invests – could consider tackling this problem by increasing legal employment opportunities for African citizens on a selective basis, depending on local needs. Such initiatives could form part of a broader strategy aimed at containing irregular migration to Europe.17
Moreover, policies that support the integration of refugees and irregular migrants into the labour market need to be tailored to those people’s skills.18 Refugees escaping major conflicts (such as the fighting in Syria) may well benefit from receiving early access to language courses and other basic training while waiting for decisions on their asylum applications. Prompt access to employment will also help refugees to integrate better into society.19
BOX 3.1. Circular migration: key to economic development?
Multinational firms spend millions of dollars seconding their workers to foreign subsidiaries and branches for training and work experience. Evidence suggests that such largesse pays off, since hiring managers and workers with foreign experience increases productivity, profitability and innovation.20 These beneficial effects of international migration do not just apply to firms: migration is also an important driver of the spread of knowledge across economies.
Source: Bahar et al. (2018).
Note: The first quartile contains the 25 per cent of industries with the lowest numbers of returning migrants in 2000, the second quartile contains the next 25 per cent, and so on.
BOX 3.2. Concentration of migrants and remittance flows from Italy
According to Eurostat, there were more than 5 million foreigners living in Italy in 2017, up from 1.5 million in 2003. If we look at the economies where those migrants come from, we can see that 6 of the top 10 are in the EBRD regions: Romania, Albania, Morocco, Ukraine, Moldova and Egypt (in declining order of importance). Italy is also home to large numbers of Chinese migrants.

Source: ISTAT (2018) and author’s calculations.
Note: The maps above show residential concentration quotients for 2016. The index is equal to 1 if the distribution of the migrant group across provinces is identical to the distribution across the general population, less than 1 if the migrant group is under-represented in a province, and greater than 1 if the group is over-represented.
Source: Bank of Italy (2018), ISTAT (2018) and author’s calculations.
Note: The chart shows the estimated coefficients from a regression framework using the Poisson pseudo-maximum likelihood. The error bars indicate the 95 per cent confidence intervals.
BOX 3.3. Migration intentions in central and south-eastern Europe: a socio-demographic profile
In 2017, the Austrian central bank, the Oesterreichische Nationalbank (OeNB) conducted another round of its regular Euro Survey, asking questions of 1,000 people aged 15 and over in 10 countries in central and south-eastern Europe (Albania, Bosnia and Herzegovina, Bulgaria, Croatia, the Czech Republic, FYR Macedonia, Hungary, Poland, Romania and Serbia). Just over 8 per cent of respondents of working age (25 to 64 years old) reported intentions to move abroad within one year of the survey. As in the Gallup survey, migration intentions were higher among younger individuals and among men. If those intentions are representative of the entire population and all those who intend to migrate do so, the demographic profile of the region will change considerably (see Chart 3.3.1). In particular, the median age of the labour force will increase further, as will the old-age dependency ratio.
Further econometric analysis of those intentions to migrate reveals that migration intentions vary considerably across regions within individual countries.24 People who live in regions with high average incomes, low levels of unemployment and a dynamic economy tend to be less likely to migrate. Moreover, it tends to be the level of regional income and unemployment, rather than the rate of economic growth, that influences migration intentions.
Source: OeNB Euro Survey (2017) and author’s calculations.
BOX 3.4. Economic development and “brain drain” in transition economies
International migration exhibits two general patterns. First of all, there is an inverted U-shaped relationship between migration and economic development, typically referred to as the “migration transition curve”.25 At income levels below approximately US$ 6,000 per capita, emigration increases as incomes rise (see Chart 3.4.1). If incomes continue to increase, emigration then subsides again. Various explanations for this relationship have been put forward, the most common being the existence of credit constraints preventing potential migrants in poorer economies from realising their aspirations. As financial constraints ease, emigration initially rises. It then falls again as income differentials between the economy of origin and potential destination economies decline.
Source: OECD and authors’ calculations.
Note: Based on a sample comprising 123 economies which excludes periods of major conflict. The results have been obtained using non-parametric kernel density estimation.27
Source: OECD and author’s calculations.
Note: Based on a sample comprising 123 economies which excludes periods of major conflict. The results have been obtained using non-parametric kernel density estimation.28
BOX 3.5. Large-scale influxes of low-skilled labour and their impact on locals’ use of skills
The Syrian civil war, which has been raging since 2011, has seen more than 5 million refugees flee to neighbouring countries. The majority of those refugees are in the EBRD regions, with more than 3.5 million in Turkey and many others in Jordan and Lebanon. Understanding the impact that these large numbers of refugees have had on local labour markets can help governments to design effective policies aimed at addressing the relevant issues.29
BOX 3.6. Immigration and populist voting in Europe
Has the recent rise in populism in advanced economies been caused by immigration and the refugee crisis? This box surveys the evidence, looking at recent studies carried out in Austria, France, Greece, Italy, Sweden and the United Kingdom – as well as a Europe-wide study of immigration and emigration. These studies show that the impact that immigration has on political outcomes depends on the composition and intensity of immigration. In particular, some studies identify a non-linear relationship between the intensity of immigration and populist voting, with a limited increase in immigration reducing support for right-wing populists – consistent with the “contact theory” posited by Allport (1954) – and a large increase in immigration having the opposite effect.
| Dependent variable (vote share) | All populists | Right-wing populists | Left-wing populists | Other populists | Anti-immigrant populists | Non-anti-immigrant populists |
|---|---|---|---|---|---|---|
| (1) | (2) | (3) | (4) | (5) | (6) | |
| External immigration rate | -6.12** | 1.34 | -5.65** | -1.80 | 0.64 | -6.75** |
| (3.06) | (1.49) | (2.33) | (1.58) | (0.84) | (2.82) | |
| External emigration rate | 4.23 | -1.84 | 4.93** | 1.13 | 0.88 | 3.35 |
| (2.93) | (1.32) | (1.94) | (1.75) | (0.79) | (2.73) | |
| Net internal migration rate | 0.94 | -0.19 | 0.86 | 0.27 | -0.00 | 0.94 |
| (1.07) | (0.56) | (1.08) | (0.47) | (0.41) | (1.12) | |
| Unemployment | -0.10 | 0.04 | -0.40 | 0.26 | -0.80 | 0.70 |
| (0.32) | (0.28) | (0.36) | (0.35) | (0.50) | (0.46) | |
| Number of observations | 510 | 510 | 510 | 510 | 510 | 510 |
| R2 | 0.93 | 0.93 | 0.86 | 0.94 | 0.94 | 0.86 |
SOURCE: Guriev et al. (2018).
NOTE: These estimates are derived from a second-stage estimation, with immigration instrumented by immigrants’ share of the population at the beginning of the period, interacted with Europe-wide immigration rates. “Other populists” are populist parties that are neither right-wing nor left-wing. Fixed effects for NUTS-2 regions and year dummies are included in all specifications. The unit of observation is the NUTS-2 region. Robust standard errors are reported in parentheses (clustered at the country level), and *, ** and *** denote values that are statistically significant at the 10, 5 and 1 per cent levels respectively.
Annex 3.1. Estimating determinants of migration intentions for potential migrants
The following linear probability models are used to study determinants of intentions to migrate abroad:


The dependent variable, ![]() , takes a value of 100 if individual
, takes a value of 100 if individual ![]() is planning to move permanently to another country within the next 12 months and 0 otherwise.
is planning to move permanently to another country within the next 12 months and 0 otherwise. ![]() and
and ![]() denote country of origin and year fixed effects respectively.
denote country of origin and year fixed effects respectively. ![]() is a set of demographic characteristics and education and labour market outcomes including gender, age bracket, marital status, level of education, employment, place of residence (urban or rural) and presence of children under the age of 15 in the household.
is a set of demographic characteristics and education and labour market outcomes including gender, age bracket, marital status, level of education, employment, place of residence (urban or rural) and presence of children under the age of 15 in the household.
The second set of controls (![]() ) includes the log differential between the individual’s current wage and the average expected wage in the stated destination country. The expected wage in the country of destination was obtained using a set of multivariate regressions, estimated separately for each country and each survey year, whereby a person’s annual log wage is explained by their age, gender and education. The coefficients from those models were then applied to each person on the basis of their preferred country of destination, assuming that returns to age, gender and education in the country of destination are the same for locals and migrants alike. Where respondents intended to migrate, but did not identify an intended destination country, the wage differential and the variables reflecting the cost of migration were calculated as weighted averages on the basis of the preferred destinations of individuals from the same country of origin with the same level of education in the same survey year.
) includes the log differential between the individual’s current wage and the average expected wage in the stated destination country. The expected wage in the country of destination was obtained using a set of multivariate regressions, estimated separately for each country and each survey year, whereby a person’s annual log wage is explained by their age, gender and education. The coefficients from those models were then applied to each person on the basis of their preferred country of destination, assuming that returns to age, gender and education in the country of destination are the same for locals and migrants alike. Where respondents intended to migrate, but did not identify an intended destination country, the wage differential and the variables reflecting the cost of migration were calculated as weighted averages on the basis of the preferred destinations of individuals from the same country of origin with the same level of education in the same survey year.
Controls also include the log of the distance between the most populous cities in the two countries, dummy variables for a common border between the two countries and a common colonial history, and an index of linguistic proximity. Additional variables capture social networks abroad and at home.
The third set of controls (![]() ) captures individual perceptions and attitudes. It includes an index reflecting life satisfaction (on a scale of 0 to 10), a dummy variable which takes the value of 1 if the respondent feels safe walking alone at night in their place of residence, a measure of trust in the national government, a dummy variable which is equal to 1 if the respondent believes that corruption is widespread within businesses located in their country, and a similar dummy for corruption in the government.
) captures individual perceptions and attitudes. It includes an index reflecting life satisfaction (on a scale of 0 to 10), a dummy variable which takes the value of 1 if the respondent feels safe walking alone at night in their place of residence, a measure of trust in the national government, a dummy variable which is equal to 1 if the respondent believes that corruption is widespread within businesses located in their country, and a similar dummy for corruption in the government.
A set of satisfaction indicators measure whether an individual is satisfied with (i) the quality of air and water, (ii) the country’s education system and schools, (iii) the availability of high-quality healthcare, (iv) the availability of good affordable housing, and (v) the quality of roads, highways and public transport systems. The satisfaction index indicates the average level of satisfaction across all of these various aspects.
Annex 3.2. Data on refugees and irregular migrants, populations of countries of origin and country characteristics
Data on refugees and irregular migrants
Data on refugees and irregular migrants are taken from the three waves of FMS surveys conducted by the IOM. The FMS survey seeks to produce quantitative estimates of the numbers of third-country nationals originating from outside the European Union who are migrating towards Europe via the central and eastern Mediterranean routes. The first wave (October to December 2015) saw interviews being conducted in Bulgaria, Croatia, FYR Macedonia, Greece, Hungary, Italy, Serbia and Slovenia. The second wave (January to November 2016) covered Bulgaria, Croatia, FYR Macedonia, Greece, Hungary, Serbia and Slovenia. And the final wave (June to November 2016) covered Italy. All in all, this sample includes data on nearly 21,000 individuals.
Population data for refugees and irregular migrants’ countries of origin
Population data for refugees and irregular migrants’ countries of origin are taken from the Gallup World Polls conducted between 2009 and 2014. These nationally representative surveys are conducted every year in more than 160 economies around the world. Each survey round covers approximately 1,000 individuals in each economy. These surveys provide detailed information on people’s demographic characteristics (such as their age, gender, level of education and marital status), as well as labour market outcomes, income levels and intentions to migrate within the next 12 months.
The Gallup and FMS data have been combined in a single sample in order to provide information on the pre-migration populations of refugees and irregular migrants’ countries of origin (those with at least 100 respondents in the FMS dataset). Each variable in the Gallup dataset has been brought into line with the definitions used in the FMS data.
Other data
The Uppsala Conflict Data Program (UCDP) dataset on conflict-related deaths has been used to classify refugees and irregular migrants’ countries of origin in terms of the intensity of conflicts. Countries are regarded as experiencing a major conflict if 1,000 or more conflict-related deaths occur in a single year between 2009 and 2014, with all other countries being placed in the “minor/no conflict” category. The results remain broadly unchanged if a year-specific measure of conflict intensity is used, with few countries moving between the two categories from one year to the next.
Annex 3.3. Estimating socio-demographic characteristics of refugees and irregular migrants
This analysis uses a series of multivariate regressions to assess the ways in which the socio-demographic characteristics of refugees and irregular migrants differ from those of the general population in their economies of origin.38 The main explanatory variables of interest are age, gender, marital status and level of education. In some specifications, estimated incomes are also included in order to understand differences between the earning potential of refugees and irregular migrants from different economies.
The following linear probability model is estimated using a combined sample comprising individuals completing FMS surveys and Gallup World Polls:

where the dependent variable,![]() , takes a value of 1 if individual
, takes a value of 1 if individual ![]() from country
from country ![]() is in the FMS sample and 0 if he/she is in the Gallup sample. The set of controls (
is in the FMS sample and 0 if he/she is in the Gallup sample. The set of controls (![]() ) includes age groups, levels of education, employment status prior to migration (employed or not) and marital status. A set of source country (
) includes age groups, levels of education, employment status prior to migration (employed or not) and marital status. A set of source country (![]() ) dummies control for all time-invariant differences across countries of origin. The analysis focuses on individuals aged 25 and over, who are therefore likely to have completed their education.
) dummies control for all time-invariant differences across countries of origin. The analysis focuses on individuals aged 25 and over, who are therefore likely to have completed their education.
Models are estimated separately for men and women and for different levels of conflict in countries of origin. Logit regressions (not reported) yield similar results.
The regressions reported in Tables 3.5 and 3.6 are based on a sample of refugees and irregular migrants whereby the outcome variables (![]() ) represent various characteristics of the stated destination country (
) represent various characteristics of the stated destination country (![]() ). The same set of control variables is included in these specifications.
). The same set of control variables is included in these specifications.

References
Y.E. Akgündüz and H. Torun (2018)
“Two and a half million Syrian refugees, skill mix and capital intensity”, GLO Discussion Paper No. 186.
C.G. Aksoy and B. Ozcan (2018)
“The Impact of Immigration on Natives’ Fertility: Evidence from Syrians in Turkey”, EBRD working paper, forthcoming.
C.G. Aksoy and P. Poutvaara (2018)
“Self-Selection of Refugees and Other Migrant Groups”, EBRD working paper, forthcoming.
Y. Algan, S. Guriev, E. Papaioannou and E. Passari (2017)
“The European trust crisis and the rise of populism”, Brookings Papers on Economic Activity, Fall.
G. Allport (1954)
The Nature of Prejudice, Addison-Wesley.
D. Bahar, A. Hauptmann, C. Ozgüel and H. Rapoport (2018)
“Let their knowledge flow: the effect of Yugoslavian returning refugees on export productivity”, mimeo.
G. Barone, A. D’Ignazio, G. de Blasio and P. Naticchioni (2016)
“Mr. Rossi, Mr. Hu and Politics. The Role of Immigration in Shaping Natives’ Voting Behavior”, Journal of Public Economics, Vol. 136, pp. 1-13.
S.O. Becker and T. Fetzer (2016)
“Does Migration Cause Extreme Voting?”, CAGE Working Paper No. 306.
G.J. Borjas (1987)
“Self-selection and the earnings of immigrants”, American Economic Review, Vol. 77(4), pp. 531-553.
S. Burkart (2018)
“Asylum seekers and populist voting in Sweden”, background note for this Transition Report.
R. Cai, N. Esipova, M. Oppenheimer and S. Feng (2014)
“International migration desires related to subjective well-being”, IZA Journal of Migration, Vol. 3.
E. Ceritoğlu, H.B. Gürcihan-Yüncüler, H. Torun and S. Tümen (2017)
“The impact of Syrian refugees on natives’ labor market outcomes in Turkey: evidence from a quasi-experimental design”, IZA Journal of Labor Policy, Vol. 6.
P. Choudhury (2016)
“Return migration and geography of innovation in MNEs: a natural experiment of knowledge production by local workers reporting to return migrants”, Journal of Economic Geography, Vol. 16, pp. 585-610.
A. Clark (2007)
“Understanding community: a review of networks, ties and contacts”, ESRC NCRM Working Paper No. 9/07.
T.H. Dao, F. Docquier, C. Parsons and G. Peri (2018)
“Migration and Development: Dissecting the Anatomy of the Mobility Transition”, Journal of Development Economics, Vol. 132, pp. 88-101.
X.V. Del Carpio and M. Wagner (2015)
“The impact of Syrian refugees on the Turkish labor market”, World Bank Policy Research Working Paper No. 7402.
E. Dinas, K. Matakos, D. Xefteris and D. Hangartner (2017)
“Waking Up the Golden Dawn: Does Exposure to the Refugee Crisis Increase Support for Extreme-Right Parties?”, mimeo.
F. Docquier, B.L. Lowell and A. Marfouk (2009)
“A gendered assessment of highly skilled emigration”, Population and Development Review, Vol. 35, pp. 297-321.
F. Docquier, G. Peri and I. Ruyssen (2014)
“The cross-country determinants of potential and actual migration”, International Migration Review, Vol. 48, pp. S37-S99.
F. Docquier and H. Rapoport (2012)
“Globalization, Brain Drain, and Development”, Journal of Economic Literature, Vol. 50, pp. 681-730.
C. Dustmann, F. Fasani, T. Frattini, L. Minale and U. Schönberg (2017)
“On the economics and politics of refugee migration”, Economic Policy, Vol. 32, pp. 497-550.
C. Dustmann and A. Okatenko (2014)
“Out-migration, wealth constraints, and the quality of local amenities”, Journal of Development Economics, Vol. 110, pp. 52-63.
C. Dustmann, K. Vasiljeva and A. Piil Damm (2016)
“Refugee Migration and Electoral Outcomes”, CReAM Discussion Paper No. 19/16.
A. Edo, Y. Giesing, J. Oztunc and P. Poutvaara (2017)
“Immigration and electoral support for the far left and the far right”, CEPII Working Paper No. 2017-20.
V.A. Epanechnikov (1969)
“Non-Parametric Estimation of a Multivariate Probability Density”, Theory of Probability and its Applications, Vol. 14, pp. 153-158.
M. Erdoğan (2014)
“Syrians in Turkey: Social acceptance and integration research”, Hacettepe University Migration and Politics Research Centre (HUGO).
L. Foster, J. Haltiwanger and C. Syverson (2008)
“Reallocation, Firm Turnover, and Efficiency: Selection on Productivity or Profitability?”, American Economic Review, Vol. 98(1), pp. 394-425.
G. Friebel, M. Manchin, M. Mendola and G. Prarolo (2017)
“Human smuggling and intentions to migrate: global evidence from a supply shock along Africa-to-Europe migration routes”, DEMS Working Paper No. 375.
Y. Giesing and N. Laurentsyeva (2018)
“Firms Left Behind: Emigration and Firm Productivity”, CESifo Working Paper No. 6815.
S. Guriev, N. Melnikov and D. Treisman (2018)
“Immigration, Emigration, and Populist Vote in Europe”, background note for this Transition Report.
M. Halla, A. Wagner and J. Zweimüller (2017)
“Immigration and Voting for the Far Right”, Journal of the European Economic Association, Vol. 15, pp. 1341-1385.
T.J. Hatton (2017)
“Refugees and asylum seekers, the crisis in Europe and the future of policy”, Economic Policy, Vol. 32, pp. 447-496.
T. Huddleston, O. Bilgili, A.-L. Joki and V. Zvezda (2015)
“Migrant Integration Policy Index 2015”, Barcelona Center for International Affairs (CIDOB) and Migration Policy Group (MPG).
S.P. Kerr, W. Kerr, C. Ozden and C. Parsons (2016)
“Global talent flows”, Journal of Economic Perspectives, Vol. 30, pp. 83-106.
J.J. Lewer, G. Pacheco and S. Rossouw (2009)
“Do Non-Economic Quality of Life Factors Drive Immigration?”, IZA Discussion Paper No. 4385.
P. Mahajan and D. Yang (2017)
“Taken by storm: hurricanes, migrant networks, and U.S. immigration”, NBER Working Paper No. 23756.
A. Mansoor and B. Quillin (eds.) (2006)
Migration and Remittances: Eastern Europe and the Former Soviet Union, World Bank.
J. Markusen and N. Trofimenko (2009)
“Teaching locals new tricks: Foreign experts as a channel of knowledge transfers”, Journal of Development Economics, Vol. 88, pp. 120-131.
A.M. Mayda (2005)
“International migration: a panel data analysis of economic and non-economic determinants”, IZA Discussion Paper No. 1590.
A.M. Mayda, G. Peri and W. Steingress (2018)
“The Political Impact of Immigration: Evidence from the United States”, CEPR Discussion Paper No. 12848.
MEDAM (2018)
Flexible Solidarity: A comprehensive strategy for asylum and immigration in the EU – 2018 MEDAM assessment report on asylum and migration policies in Europe, Mercator Dialogue on Asylum and Migration, Kiel.
K. Munshi (2003)
“Networks in the modern economy: Mexican migrants in the U.S. labor market”, The Quarterly Journal of Economics, Vol. 118, pp. 549-599.
OECD (2018)
Engaging with Employers in the Hiring of Refugees, Paris.
D.A. Plane and P.A. Rogerson (1994)
The Geographical Analysis of Population: With Applications to Planning and Business, John Wiley.
A. Raggl (forthcoming)
“Migration intentions in CESEE – Evidence from OeNB Euro Survey data”, Focus on European Economic Integration, Oesterreichische Nationalbank.
J.M.C. Santos Silva and S. Tenreyro (2006)
“The log of gravity”, The Review of Economics and Statistics, Vol. 88, pp. 641-658.
A. Steinmayr (2018)
“Contact Matters: Exposure to Refugees and Voting for the Far-Right”, mimeo.
UN DESA (2017a)
Trends in international migrant stock: The 2017 revision, New York.
UN DESA (2017b)
International Migration Report 2017, New York.
UNHCR (2018)
Global Trends: Forced Displacement in 2017, Geneva.
P. Vertier and M. Viskanic (2018)
“Dismantling the ‘Jungle’: Migrant Relocation and Extreme Voting in France”, CESifo Working Paper No. 6927.
World Bank (2018)
Asylum seekers in the European Union: building evidence to inform policy making, Washington, D.C.
W. Zelinsky (1971)
“The Hypothesis of the Mobility Transition”, Geographical Review, Vol. 61, pp. 219-249.
N. Zoubanov (2004)
“Assessing general and country-specific determinants of migration in the European Union: a panel data approach”, paper presented at the IZA Summer School.
Subscribe to the EBRD Transition Report 2018-19 mailing list.
Sign up to receive important announcements and emails about the Transition Report.