
Skills, employment and automation
Over the past 25 years, the economies of the EBRD regions have created an average of 1.5 million jobs per year. However, the nature of work is changing, with automation on the rise. Many economies where the EBRD invests have experienced deindustrialisation, as well as the polarisation of employment – a decline in the number of medium-skilled jobs. While technological change is resulting in increased demand for skilled labour, many of these economies face significant gaps in terms of the quality of education, as well as substantial emigration by skilled workers. In the short term, the emigration of skilled workers reduces the productivity of firms in the country of origin. In the longer term, however, emigration has boosted the transfer of knowledge to the EBRD regions and supported innovation.
Introduction
Rapid technological change is having a profound impact on the nature of work and the types of skill that are in demand in the workplace.1 One example of this is the advent of financial technology (fintech), which has brought about the rise of online banking and resulted in a reduction in the number of traditional high-street bank branches. In some cases, economic policy has struggled to keep pace with such developments (see, for instance, Annex 2.1 for a discussion of regulatory frameworks governing crowdfunding). The EBRD regions have not been immune to these trends. Indeed, the demographic pressures in emerging Europe have created particularly strong incentives for automation (as discussed in Chapter 1).
Demand for and supply of skills
Deindustrialisation
It is difficult to assess demand for specific skills at a particular point in time. However, the employment shares of specific occupations can provide a useful approximation of such demand, as skills used at work tend to be specific to a particular industry or occupation.3 Changes in employment shares over time provide important insights into the creation and disruption of jobs as a result of technological change.
Job polarisation
Automation has reduced demand for certain routine cognitive tasks. Since the early 1990s, job creation has been concentrated mainly in low-skilled occupations (such as catering, construction and cleaning) that are harder to automate than computational tasks, as well as high-skilled occupations (such as professional services and research and development).4 Highly paid skilled work, in turn, raises demand for relatively poorly paid personal services (such as cleaning or catering), reinforcing the polarisation of occupations into what Goos and Manning (2007) called “lovely” and “lousy” jobs.
Quantity of education versus quality of skills
The supply of skills has also been evolving. Indeed, the percentage of workers with university degrees has continued to rise across the EBRD regions, with the exception of Albania, Tajikistan and Turkey (see Chart 2.4). Levels of educational attainment in the EBRD regions are relatively high. In Russia, for example, 59 per cent of adults have university degrees, compared with an average of 28 per cent in advanced economies. In Ukraine, the figure is 40 per cent; and in Estonia, it is 30 per cent. The average number of years of education in the EBRD regions exceeds the equivalent figure for advanced economies.
However, a large quantity of education does not automatically translate into a high-quality education. The quality of education can be measured using the OECD’s PISA study, which tests the numeracy, science skills and analytical reading of 15-year-old students in OECD member countries and a number of emerging markets. Economies in the EBRD regions tend to perform fairly poorly in PISA studies relative to their large numbers of years of education (see Chart 2.5). Indeed, the EBRD economies that participated in the 2015 PISA study achieved an average score of 440 across all subjects, compared with an average of 496 in advanced economies.
Lack of ICT skills in the age of automation
This gap between the quantity and quality of education is even more apparent if we look at information and communication technology (ICT) skills, which are becoming increasingly important in light of technological change. While economies in the EBRD regions generally performed strongly in the OECD’s PIAAC surveys in 2011-14, which looked at adult skills (see Chapter 1), their performance was weaker when it came to advanced ICT and cognitive skills that were needed to solve technical problems and accomplish complex tasks (see Chart 2.6). The percentage of the population who are considered to have good ICT skills ranges from 10 per cent in Turkey to 33 per cent in Estonia. Box 2.3 looks at skills mismatches in the SEMED region, which was not covered by those PIAAC surveys.
Source: ILO and authors’ calculations.
Note: Averages weighted by size of labour force. “Business services” comprise ISIC sectors I (accommodation and food services), K (financial and insurance activities), L, M and N (real estate, business and administrative activities). “Non-market services” comprise ISIC sectors O (public administration and defence), P (education), Q (healthcare and social work), R, S, T and U (other services).
Source: ILO modelled estimates and authors’ calculations.
Note: Weighted averages across 25 economies. Occupations are based on the International Standard Classification of Occupations’ ISCO-08 classification and are ranked from left to right in declining order of skill-intensity. “Professionals” include engineering, healthcare, teaching, business and IT professionals. “Clerks” include keyboard clerks, service clerks and numerical or material recording clerks. “Craft workers” include construction workers, metal or machinery workers, handicraft or printing workers, electrical workers and food processing workers. “Service and sales workers” include personal services workers, sales workers, personal care workers and protective services workers. “Elementary occupations” include cleaners and helpers, agricultural labourers, food preparation assistants and refuse workers.
Source: ILO modelled estimates and authors’ calculations.
Note: Based on methodology in OECD (2017) and ISCO-88 classifications. “EM-5” comprises Argentina, Brazil, Malaysia, South Africa and Thailand. High-skilled occupations comprise legislators, senior officials and managers (group 1), professionals (group 2) and technicians and associate professionals (group 3). Medium-skilled occupations comprise clerks (group 4), craft workers and related tradespersons (group 7), and plant and machine operators and assemblers (group 8). Low-skilled occupations comprise service and sales workers (group 5) and elementary occupations (group 9). Data for Kazakhstan relate to the period 2006-15 and data for Montenegro relate to the period 2006-17.
- ▲ Economies in the EBRD regions
- ▲ Emerging markets
- ▲ Advanced economies
Source: Barro and Lee (2013) and authors’ calculations.
- ▲ Economies in the EBRD regions
- ▲ Emerging markets
- ▲ Advanced economies
Source: BOECD and Barro and Lee (2013).
Note: PISA scores for Argentina, Kazakhstan, Malaysia and Serbia relate to 2012.
Source: OECD and authors’ calculations.
Note: “Good ICT skills” correspond to level 2 or 3 in the OECD’s PIAAC tests.
How automation is reshaping labour markets
Technological innovations are quickly shifting the balance between activities performed by humans and tasks performed by machines. Indeed, recent research suggests that nearly 50 per cent of all jobs in the United States of America face a high risk of being automated in the foreseeable future.6 In developing countries, the risk of automation may be even higher, with up to 70 per cent of jobs at risk.7 In manufacturing, the percentage of jobs that are at risk of automation may be particularly high.
While technological change inevitably gives rise to anxieties, history suggests that although some jobs will be destroyed, others will be created. Indeed, such innovations can help to shift labour from sectors with low levels of productivity (such as agriculture) to higher-productivity sectors (primarily manufacturing and services). This section revisits the subject of automation, looking at the impact that technological change has had on employment in the EBRD regions.
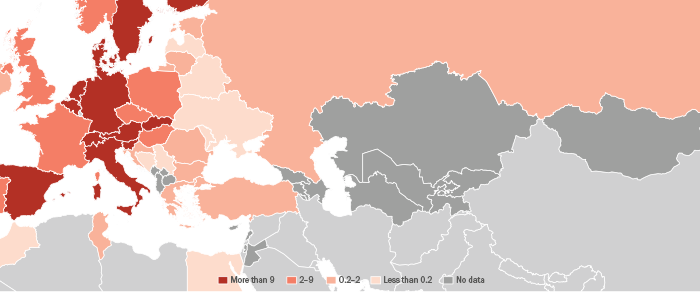
Use of robots in the EBRD regions
A useful measure of the extent of automation is the total stock of operational industrial robots, which are defined by the International Organization for Standardization (ISO) as “automatically controlled, reprogrammable, multipurpose manipulators that are programmable in three or more axes”.
Impact of robots on employment
Automation affects employment in two different ways. In some instances, robots may directly replace workers. However, firms that experience increases in productivity as a result of automation may also increase their demand for labour where it is complementary to the use of robots. In the 11 EBRD economies included in analysis of this issue (see Annex 2.3 for a description of the relevant data), the average employment rate (defined as the percentage of the labour force that is in employment) declined by 1.5 percentage points between 2010 and 2016, while the average number of robots increased by 0.3 per 1,000 workers over the same period.
Probability of jobs being automated varies across economies
The probability of a typical (median) job being automated in the near future varies from country to country (see Chart 2.11). A job is considered to be at risk of being automated if most of the tasks involved could be performed by state-of-the-art computer-controlled equipment based on the availability of big data needed to complete such tasks.10
In nearly all of the EBRD economies included in Chart 2.11, the probability of the median job being automated is higher than the OECD average of 48 per cent, with Estonia being the only exception. In the Slovak Republic, the median probability of automation is as high as 62 per cent. Meanwhile, a higher probability of automation is associated with a lower projected employment-to-population ratio in 2022.11
Probability of automation also varies across industries
In the EBRD regions, jobs in textile manufacturing, agriculture, food processing, the manufacturing of wood products and land transport are expected to be most affected by automation (see Chart 2.12). At the other end of the scale, fewer than 43 per cent of all jobs in financial, legal and accounting services, telecommunications, computer programming and education are expected to be significantly affected by automation. More generally, automation is expected to affect primary-sector jobs most and services least.
Repeating this analysis at the level of individual occupations shows that food preparation assistants, cleaners and helpers, assemblers, refuse workers, drivers and mobile plant operators face the highest risk of automation (see Chart 2.13). Occupations that require significant analytical skills and high levels of social interaction (such as managers, professionals and senior officials) are among those least likely to be automated.
Source: International Federation of Robotics (IFR) and authors’ calculations.
Source: IFR, ILO and authors’ calculations.
Note: Data relate to 2016.
Source: IFR, ILO and authors’ calculations.
| Dependent variable | Change in employment rate, 2010-16 | |||
|---|---|---|---|---|
| (1) | (2) | (3) | (4) | |
| Increase in exposure to robots, 2010-16 | -0.0077** | -0.0079** | -0.0075** | -0.0072** |
| (0.0037) | (0.0036) | (0.0035) | (0.0035) | |
| Increase in ICT-intensity, 2010-16 | -0.1653*** | |||
| (0.0542) | ||||
| Country dummies | No | No | Yes | Yes |
| Country-level controls | No | Yes | No | No |
| Number of observations | 471 | 471 | 471 | 471 |
SOURCE: Eurostat, IFR and authors’ calculations.
NOTE: See Annex 2.4 for details of this instrumental variables (IV) estimation. Robust standard errors are reported in parentheses, and *, ** and *** denote values that are statistically significant at the 10, 5 and 1 per cent levels respectively.
Source: Eurostat, IFR and authors’ calculations.
Note: Based on regression analysis for individual demographic groups (see Annex 2.4 for details). Lines correspond to the 95 per cent confidence intervals associated with these estimates.
Source: ILO and authors’ calculations based on Nedelkoska and Quintini (2018).
Source: Nedelkoska and Quintini (2018) and authors’ calculations.
Note: Based on two-digit ISIC classification (rev. 4). Jobs are at high risk of automation if at least 70 per cent of the tasks involved are at risk of being automated. Jobs are at significant risk of automation if between 50 and 70 per cent of tasks are at risk of being automated. Estimates are simple averages across Cyprus, Estonia, Greece, Lithuania, Poland, the Slovak Republic, Slovenia and Turkey. Industries with fewer than 10 observations in four countries or more have been excluded.
Source: Nedelkoska and Quintini (2018) and authors’ calculations.
Note: Based on two-digit ISCO-08 classification. Jobs are at high risk of automation if at least 70 per cent of the tasks involved are at risk of being automated. Jobs are at significant risk of automation if between 50 and 70 per cent of tasks are at risk of being automated. Estimates are simple averages across Cyprus, Estonia, Greece, Lithuania, Poland, the Slovak Republic, Slovenia and Turkey. Occupations with fewer than 10 observations in four countries or more have been excluded.
The impact of emigration on firms’ performance and innovation
This section looks at the economic implications of the large-scale emigration that is being experienced by many economies where the EBRD invests. Its empirical analysis focuses on the experiences of EU member states in the EBRD regions, but its findings are applicable to other countries as well. For example, several economies in the EBRD regions are seeking EU membership, while others (such as Ukraine) are not involved in the accession process but are experiencing high rates of emigration among people of working age. For example, Poland issued nearly one million work permits to Ukrainian citizens between 2014 and 2017.
Labour market access for new EU member states
When the Czech Republic, Estonia, Hungary, Latvia, Lithuania, Poland, the Slovak Republic and Slovenia joined the EU in 2004, followed by Bulgaria and Romania in 2007, those new EU member states experienced significant increases in the numbers of workers emigrating to the EU-15 and the four European Free Trade Association (EFTA) countries (namely, Iceland, Liechtenstein, Norway and Switzerland). By 2014, when all restrictions on migration from those new member states had been lifted, the number of migrants who had travelled to those 19 countries stood at four million, compared with 900,000 in 2003 (see Annex 2.5 for more details).
The effects of emigration on firms’ performance
When emigration opportunities for economically active members of the population increase, firms in the countries of origin of potential migrants face more intense competition for labour. As a result, they may have to offer higher wages in order to retain or attract skilled employees. Alternatively, firms can make production more capital-intensive by replacing highly qualified labour with capital and less-skilled workers or choose a different product mix (see also Box 3.5 which discusses firms’ responses to the opposite trend, namely an increase in low-skilled immigration). However, such adjustments are costly and may not be feasible for all firms. They may also have an impact on firms’ TFP.
The impact that emigration has on innovation
Emigration by skilled workers can potentially leave countries lacking the skills that are necessary to support innovation. However, emigrants often maintain close ties with their country of origin. Not only do they send remittances to family members, they also share acquired knowledge with former colleagues and employers, and the resulting cross-border knowledge flows have the potential to offset the negative impact on innovation.17 In addition, migrants can also facilitate trade and FDI links. Moreover, migrants who return to their country of origin after a number of years abroad will bring with them any knowledge acquired abroad and may, in some cases, establish new firms. This may have a further indirect effect on innovation.18
Source: Amadeus and authors’ calculations.
Note: See Annex 2.5 for details of this regression analysis. Lines show the 95 per cent confidence interval for each estimate. “TFP LP” is TFP as estimated in Levinsohn and Petrin (2003).
Source: Amadeus and authors’ calculations.
Note: Estimated using the Levinsohn-Petrin procedure. See Annex 2.5 for details.
Source: European Patent Office’s Worldwide Patent Statistical Database (PATSTAT) and authors’ calculations.
Note: See Annex 2.5 for details of this regression analysis.
Source: PATSTAT and authors’ calculations.
Note: See Annex 2.5 for details of this regression analysis. Lines show the 95 per cent confidence interval for each estimate.
Conclusion
Over the last decade, many economies in the EBRD regions have experienced deindustrialisation and increased polarisation of jobs. The employment shares of the agriculture and manufacturing sectors have declined substantially, with professionals and service or sales workers now accounting for larger percentages of the labour force.
With a few exceptions, economies where the EBRD invests have tended to see improvements in educational attainment. At the same time, however, economies in the EBRD regions are lagging behind advanced comparators in terms of ICT-related skills, and the OECD’s PISA tests point to wider challenges in terms of the quality – as opposed to the quantity – of education. Closing the gap in terms of ICT-related skills will help the regions’ economies to leverage the benefits of future technological change while minimising the disruptive impact that digitalisation has on the labour market.19 This may also help to leverage the full potential of online training courses and distance learning.
These economies have also seen profound technological change, as reflected in the rapidly rising numbers of industrial robots in operation. This increase in automation is estimated to account for 13 per cent of the total decline in employment in these economies. This effect is particularly pronounced among workers who are only educated to primary level. Policy responses to technological change need to do more to align the supply of skills with the demands of industry, as well as reducing barriers to education and increasing training opportunities for the most disadvantaged workers (as discussed in Chapter 1).
In many countries where the EBRD invests, skills shortages have been exacerbated by the emigration of skilled workers. The analysis in this chapter shows that the TFP of firms whose workers have had increased opportunities to emigrate following their countries’ accession to the EU has been significantly lower than it would have been in the absence of emigration. On the other hand, foreign-owned and innovative firms have not experienced a negative impact on productivity, as they have been able to adjust to the changing environment by increasing personnel-related spending. Policies that support training and the upgrading of local skills, such as subsidies for training newly hired workers, can help firms to deal with increased employee turnover and minimise the adverse effects of emigration.
In the longer term, innovative firms in migrants’ countries of origin benefit from larger inflows of knowledge on the back of higher levels of emigration. Indeed, an increase in knowledge transfers attributable to emigration has, over time, helped new EU member states to narrow the gap relative to advanced European economies in terms of numbers of patents and the quality of those patents. The positive impact that emigration has on innovation can be leveraged further by means of special programmes aimed at encouraging highly skilled emigrants to return to their country of origin. Conferences that put emigrants in contact with local inventors and firms can also help to increase cross-border knowledge flows.
BOX 2.1 Enabling women to work more productively
The lack of availability or declining quality of public services is a major concern in many countries. In many post-communist countries, women bear the brunt of inadequate public services, as responsibility for caring for children, the elderly and the disabled has shifted back from the state to individuals.20 In other regions (for instance, in some SEMED economies), such services were never really part of countries’ social infrastructure in the first place.
BOX 2.2. Projected labour market changes in the EBRD regions
There are many uncertainties in the world of work when it comes to the future of jobs and employment relationships. For example, there are concerns that employment conditions may deteriorate with the rise of the platform economy (economic activity that is made possible by new technological platforms). Similarly, the reallocation of labour across economic sectors – an intrinsic element of structural transformation – is also a cause of significant uncertainty.
Changes in working conditions owing to employment shifts across industries
Employment conditions can vary significantly across sectors and industries within a given country. ILO (2018b) presents a comprehensive analysis of the impact that employment shifts across sectors have on working conditions at the global level using a partial shift-share analysis. This methodology takes account of the impact that inter-sector changes have on working conditions, but takes no account of the impact of intra-sector changes.
Source: ILO.
Note: These estimates are based on shift-share analysis, as described in ILO (2018b).
BOX 2.3. Skills mismatches in the SEMED region
Skills mismatches – discrepancies between the supply of and demand for skills – remain an important bottleneck when it comes to economic development in the SEMED region, curtailing economic opportunities for employers and employees alike. Employers have to spend more on on-the-job training and endure lengthy recruitment campaigns, while workers have fewer employment opportunities. Many workers languish in jobs that they are overqualified for or take on duties that they are ill-prepared for, with negative implications for the aggregate productivity of the region’s economies.
Annex 2.1. Best practices for regulating crowdfunding
Introduction
This section of the Transition Report 2018-19 examines best practices for regulating investment-based and lending-based crowdfunding.
Lending-based crowdfunding is a form of crowdfunding whereby money is lent to individuals or businesses with a view to achieving a financial return in the form of interest payments and the repayment of capital over time.
In the case of investment-based crowdfunding, money is invested in unlisted shares or debt securities issued by businesses.
Crowdfunding as a means of accessing finance
In the past few years, disruptive innovation has thrived and flourished in the financial services sector. Financial technology – “fintech” for short – is changing finance in many different ways. This disruption is posing a challenge to existing financial sector actors, but it is also creating opportunities – both for existing actors and for new entrants. By establishing an online market place where investors can be paired with investees, investment-based crowdfunding is increasing the level of competition in capital markets. Similarly, lending-based crowdfunding is boosting competition in respect of retail financial services by bringing lenders and borrowers together.
Risks associated with crowdfunding
As with all investment, crowdfunding entails a number of risks, including project and liquidity risks, the risk of cyberattacks and the risk of platform failures. The lack of experience and expertise among potential investors is a major concern, particularly given the limited mandatory screening of borrowers in some jurisdictions (including the USA).
Other concerns relate to the reliability of investment, the lack of regulation and the existence of differing regulatory regimes for retail investors and SMEs. At the same time, if appropriate safeguards are put in place in order to protect investors, crowdfunding has the potential to act as an important source of non-bank financing, helping to support job creation, economic growth and competitiveness.
Findings of the EBRD’s study
The question of what constitutes best practice as regards the regulatory framework governing crowdfunding platforms in a specific jurisdiction must necessarily take account of, and be informed by, the broader context in that particular jurisdiction. As a result, there is no one-size-fits-all approach when it comes to regulating platforms. That being said, the EBRD’s study succeeded in identifying certain aspects of regulatory frameworks which appear to represent best practice and would probably prove beneficial in the vast majority of jurisdictions (as well as a number of optional additional measures, which could also be deployed depending on the context).
Conclusion
The EBRD hopes that these recommendations will help regulators in the EBRD regions to establish effective regulations governing crowdfunding platforms – which will, in turn, give greater legitimacy to those platforms, while ensuring that investors are adequately protected.
| Benefits for those seeking capital | Benefits for those providing capital | Broader benefits for entrepreneurs | Benefits for the economy or society |
|---|---|---|---|
|
|
|
|
SOURCE: EBRD.
Annex 2.2. Job polarisation and macroeconomic indicators
| Job polarisation | Log of increase in robot density (2006-16) | Trade openness (2014) | Employment share of primary sector (2016) | Human Capital Index (2014) | Log of GDP per capita (2016) | |
|---|---|---|---|---|---|---|
| Job polarisation | 1 | |||||
| Log of increase in robot density (2006-16) | -0.41*** | 1 | ||||
| -0.34 | ||||||
| Trade openness (2014) | -0.28** | 0.32** | 1 | |||
| -0.15 | 0.51** | |||||
| Employment share of primary sector (2016) | 0.58*** | -0.46*** | -0.27*** | 1 | ||
| 0.76*** | -0.66*** | -0.51*** | ||||
| Human Capital Index (2014) | -0.20* | 0.56*** | 0.25*** | -0.75*** | 1 | |
| 0.02 | 0.41* | 0.50*** | -0.39** | |||
| Log of GDP per capita (2016) | -0.34*** | 0.15 | 0.45*** | -0.65*** | 0.58*** | 1 |
| -0.61** | 0.84*** | 0.38** | -0.73*** | 0.34* |
SOURCE: ILO, IFR, Penn World Tables, IMF and authors’ calculations.
Note: Based on 155 economies. *, ** and *** denote values that are statistically significant at the 10, 5 and 1 per cent levels respectively. “Job polarisation” is the change in the employment share of medium-skilled occupations over the period 2006-16 in percentage points. “Trade openness” is the sum of exports and imports as a percentage of GDP. In each case, the top value relates to the global sample and the bottom value relates to the economies of the EBRD regions.
Annex 2.3. Data on the use of robots, employment and ICT
Use of robots and employment
Data on the stock of industrial robots by industry, country and year come from the IFR and are based on annual surveys of robot suppliers. This dataset covers 22 economies in the EBRD regions and relates to the period 1993-2016. Dedicated industrial robots that are designed to perform a single task are not included in the dataset.
Data are also taken from the micro-level harmonised Labour Force Survey conducted by Eurostat, which covers 11 countries where the EBRD invests (Bulgaria, Croatia, Estonia, Greece, Hungary, Latvia, Lithuania, Poland, Romania, the Slovak Republic and Slovenia). Using those surveys, the outcome variable (the employment rate) can be constructed for specific demographic groups by aggregating individual responses by age, level of education, gender or industry (whereby socio-economic groups with fewer than five observations are disregarded).33
ICT-intensity
In line with Marcolin et al. (2016), the ICT-intensity of an industry is defined as the percentage of employees in that industry who have ICT-related occupations, on the basis of the pan-EU Labour Force Survey. ICT-related occupations include computing professionals and associate professionals (for instance, computer system designers and industrial robot controllers), plus electrical and electronic equipment mechanics and fitters. Data on total populations and working-age populations are taken from the World Bank’s World Development Indicators database. Exposure to Chinese imports is calculated as the change in Chinese imports between 2010 and 2016 using bilateral trade flow data from UN Comtrade.
Firms’ performance
Firm-level panel data for the period 2000-14 come from Bureau Van Dijk’s Amadeus dataset. This annual dataset covers all industries and provides information on firms’ size, sales, profits, employment costs, materials, assets, ownership structures and patents. These data are used to estimate TFP.
Innovation
Data on innovation come from the autumn 2014 edition of the European Patent Office’s Worldwide Patent Statistical Database (PATSTAT) and cover 32 European countries. They include information on the location of the inventors and applicants for each patent. The number of patent applications in a given country serves as a measure of innovation, while the number of cross-border citations serves as a measure of knowledge flows.
The number of patent applications is aggregated by country, industry and year. The number of patent citations is aggregated by patenting country (the country of origin), cited country (the destination country), industry and year. If a patent has several international collaborators, it is assigned to the various countries in proportion to the number of inventors from each country. The sample covers the period 2000-14.
Other variables
Data on industry-level output, investment and employment, as well as bilateral industry-specific FDI flows, come from Eurostat. Measures of countries’ proximity to each other and data on bilateral trade flows are taken from the CEPII database. Country-level variables such as GDP and FDI come from the World Bank.
Annex 2.4. Estimating the impact that robotisation has on employment
The following IV specification is estimated in order to establish the causal relationship between robotisation and the employment rate (defined as the percentage of the labour force that is in employment) across various industries and countries:

The dependent variable is the change in the employment rate between 2010 and 2016, calculated separately for each gender (g), age group (a) and level of educational attainment (e) in country c and industry i.

is the change in the number of robots deployed per 1,000 workers in country c and industry i between 2010 and 2016. Total employment in country c and industry i in 2009 is used as the denominator for robot density ratios to ensure that those ratios do not capture robot-induced changes in employment in the sample period.34 Country dummies ![]() control for all time-invariant country characteristics.
control for all time-invariant country characteristics. ![]() (the change in the percentage of employees with ICT-related occupations within each industry in a given country between 2010 and 2016) measures exposure to ICT.
(the change in the percentage of employees with ICT-related occupations within each industry in a given country between 2010 and 2016) measures exposure to ICT.
The time period chosen, 2010-16, focuses the analysis on medium-term trends. Various fixed effects absorb trends that are common across particular countries, industries and demographic groups. Robust standard errors are two-way clustered at the country-industry level. All regressions are weighted by the baseline industry employment structure in each country to account for differences in the relative importance of industries.35 Some specifications also include the total population, the share of the working-age population and exposure to Chinese imports.
There remains a concern that certain unobserved trends may affect both robotisation and employment in the absence of a causal relationship between the two. Causality could also run in the opposite direction, with changes in the employment rate affecting robotisation. In order to address such concerns, this analysis follows the example of Acemoğlu and Restrepo (2017) in using two-stage least squares (2SLS) with IV. The instrument,

captures changes in the use of robots across various sectors in 11 comparator economies outside the EBRD regions. Such changes capture trends in robotisation, but are not influenced by changes in employment in the EBRD regions.
Annex 2.5. Estimating the impact that the emigration of skilled workers has on firms
This annex looks at the empirical strategy that is used to establish the causal impact which emigration has on firms’ performance. Baseline estimations represent regressions of firm-level outcomes (TFP, personnel costs and capital-to-labour ratios) on the labour mobility index.
Institutional background to labour mobility
A total of 10 countries (including eight in central Europe) joined the EU in 2004, and Bulgaria and Romania followed suit in 2007. The existing EU member states (the EU-15) and the four EFTA countries (Iceland, Liechtenstein, Norway and Switzerland) were able to restrict the free movement of labour from those new EU member states for up to seven years. Countries exercised this right to varying degrees. For example, the United Kingdom completely opened up its labour market to the 10 countries that acceded to the EU in 2004. In contrast, France kept transitional provisions in place until 2008, limiting free movement of labour to construction, tourism and catering. The United Kingdom then restricted migration from Bulgaria and Romania for the full seven years (that is to say, until 2014). At the other end of the spectrum, Germany restricted migration from all new EU member states for the full seven years.
Indicator of labour mobility
The differences between new EU member states’ access to the labour markets of advanced European economies are captured by a set of dummy variables ![]() , which are defined for each new member state (o), industry (i), potential destination country (d) and year (t). The indicator takes a value of 1 if legislation in the destination country opened that specific industry up to migration from the new member state in question; otherwise, it has a value of 0.
, which are defined for each new member state (o), industry (i), potential destination country (d) and year (t). The indicator takes a value of 1 if legislation in the destination country opened that specific industry up to migration from the new member state in question; otherwise, it has a value of 0.
Those legislation-based dummy variables are, in turn, multiplied by a measure of labour shortages in a given industry in a destination country. This measure captures the percentage of firms that are constrained by the unavailability of labour according to a European Commission business survey.
The resulting variable captures not only legislative barriers to migration, but also implicit industry-specific demand for migrants in destination countries. The weighted average of these variables can be used to measure exposure to emigration for each industry in a given country of origin. The weights applied to potential destination countries are based on the distance between the largest cities in the two countries in question. For instance, firms in Estonia are more likely to be exposed to emigration when Finland’s labour market opens up, rather than when restrictions are lifted in Malta.

In this instance, variation in the rules governing labour market access was driven mainly by the political landscapes in the various destination countries and is unlikely to have been related to the performance of firms in the countries of origin of potential migrants.36 It can therefore be used to establish the causal impact that emigration had on firms’ performance.
The resulting labour mobility index (FLM) is standardised such that it ranges from 0 to 1 and can be used as follows in reduced-form regressions capturing the intention-to-treat effect:

Dependent variables are measures of firms’ performance. Control variables include the age of the firm ![]() , as well as industry-specific variables
, as well as industry-specific variables ![]() such as total investment and average mark-up (the ratio of revenues to costs) which reflect common trends in terms of competition or demand for labour that may affect firms’ performance.
such as total investment and average mark-up (the ratio of revenues to costs) which reflect common trends in terms of competition or demand for labour that may affect firms’ performance. ![]() are industry-specific controls measured at the aggregate EU level. These include total sales and labour shortages. Country-level controls
are industry-specific controls measured at the aggregate EU level. These include total sales and labour shortages. Country-level controls ![]() include an EU membership dummy, GDP and FDI inflows. Specifications include firm and time fixed effects. Standard errors are clustered at the country-industry level (two-digit NACE37 level).
include an EU membership dummy, GDP and FDI inflows. Specifications include firm and time fixed effects. Standard errors are clustered at the country-industry level (two-digit NACE37 level).
Firm-level TFP is calculated using a TFP index, as in Gorodnichenko and Schnitzer (2013), or using a semi-parametric approach in line with Levinsohn and Petrin (2003). The latter method accounts for the fact that unobserved productivity shocks may affect firms’ inputs and performance at the same time. The return on assets (the ratio of earnings before interest and tax to total sales) is used as an alternative measure of productivity.
Impact on knowledge flows
The following empirical model estimates the effect that emigration has on knowledge flows between destination country d and country of origin o in industry i in year t:

The outcome of interest is the log of the number of times that patents in destination countries are cited in patents filed by inventors from migrants’ countries of origin (in this case, the 10 new EU member states in central and south-eastern Europe). For example, the number of Belgian patents that are cited in Polish patents filed in year t measures knowledge flows from Belgium to Poland.
Patenting asymmetries
A similar regression analysis is used to estimate the effect that emigration has on innovation. It uses the same set of explanatory variables, while the outcome variable is the difference between the log of the number of patent applications in migrants’ countries of destination and the equivalent figure for their countries of origin, calculated for each industry and year. This measure captures convergence between new EU member states and advanced European economies in terms of industry-specific innovation. The coefficients for the various lags relative to the introduction of free movement of labour (![]() ) indicate whether convergence in patenting within individual industries has become stronger following the introduction of free movement.
) indicate whether convergence in patenting within individual industries has become stronger following the introduction of free movement.
References
D. Acemoğlu and P. Restrepo (2017)
“Robots and Jobs: Evidence from US Labor Markets”, NBER Working Paper No. 23285.
D.H. Autor and D. Dorn (2013)
“The Growth of Low-Skill Service Jobs and the Polarization of the US Labor Market”, American Economic Review, Vol. 103(5), pp. 1553-1597.
D. Bahar and H. Rapoport (2018)
“Migration, Knowledge Diffusion and the Comparative Advantage of Nations”, The Economic Journal, Vol. 128, pp. F273-F305.
M. Baker, J. Gruber and K. Milligan (2008)
“Universal Child Care, Maternal Labor Supply, and Family Well-Being”, Journal of Political Economy, Vol. 116, pp. 709-745.
R. Barro and J.-W. Lee (2013)
“A New Data Set of Educational Attainment in the World, 1950-2010”, Journal of Development Economics, Vol. 104, pp. 184-198.
R.P. de Barros, P. Olinto, T. Lunde and M. Carvalho (2011)
“The Impact of Access to Free Childcare on Women’s Labor Market Outcomes: Evidence from a Randomized Trial in Low-Income Neighborhoods of Rio de Janeiro”, paper prepared for the 2011 World Bank Economists’ Forum.
U. Batsaikhan, Z. Darvas and I. Raposo (2018)
“People on the Move: Migration and Mobility in the European Union”, Bruegel Blueprint Series, Vol. 28.
S. Berlinski and S. Galiani (2007)
“The effect of a large expansion of pre-primary school facilities on preschool attendance and maternal employment”, Labour Economics, Vol. 14, pp. 665-680.
N. Bloom, C. Propper, S. Seiler and J. Van Reenen (2015)
“The impact of competition on management quality: evidence from public hospitals”, The Review of Economic Studies, Vol. 82, pp. 457-489.
F. Chiacchio, G. Petropoulos and D. Pichler (2018)
“The Impact of Industrial Robots on EU Employment and Wages: A Local Labour Market Approach”, Bruegel Working Papers, Issue 2.
P. Choudhury (2016)
“Return migration and geography of innovation in MNEs: a natural experiment of knowledge production by local workers reporting to return migrants”, Journal of Economic Geography, Vol. 16, pp. 585-610.
A.F. Constant (2011)
“Sizing It Up: Labor Migration Lessons of the EU Enlargement to 27”, IZA Discussion Paper No. 6119.
M. Costa Dias, W. Elming and R. Joyce (2016)
“The gender wage gap”, IFS Briefing Note No. BN186.
W. Dauth, S. Findeisen, J. Südekum and N. Wößner (2017)
“German Robots – The Impact of Industrial Robots on Workers”, Institute for Employment Research Discussion Paper No. 30/2017.
C. Dustmann, T. Frattini and A. Rosso (2015)
“The Effect of Emigration from Poland on Polish Wages”, The Scandinavian Journal of Economics, Vol. 117, pp. 522-564.
EBRD (2018)
“Innovative and alternative finance: best practices for the regulation of crowdfunding platforms”.
B. Elsner (2013)
“Does emigration benefit the stayers? Evidence from EU enlargement”, Journal of Population Economics, Vol. 26, pp. 531-553.
G.J. Felbermayr and B. Jung (2009)
“The pro-trade effect of the brain drain: Sorting out confounding factors”, Economics Letters, Vol. 104, pp. 72-75.
S. Flynn and M. Harris (2015)
“Mothers in the New Zealand workforce”, Labour, Employment and Work in New Zealand, Statistics New Zealand.
C.B. Frey and M.A. Osborne (2017)
“The future of employment: How susceptible are jobs to computerisation?”, Technological Forecasting and Social Change, Vol. 114, pp. 254-280.
C. Gathmann and U. Schönberg (2010)
“How general is human capital? A task-based approach”, Journal of Labor Economics, Vol. 28, pp. 1-49.
X. Gong, R. Breunig and A. King (2010)
“How Responsive is Female Labour Supply to Child Care Costs? New Australian Estimates”, IZA Discussion Paper No. 5119.
M. Goos and A. Manning (2007)
“Lousy and lovely jobs: The rising polarization of work in Britain”, The Review of Economics and Statistics, Vol. 89, pp. 118-133.
Y. Gorodnichenko and M. Schnitzer (2013)
“Financial constraints and innovation: Why poor countries don’t catch up”, Journal of the European Economic Association, Vol. 11, pp. 1115-1152.
G. Graetz and G. Michaels (2018)
“Robots at Work”, LSE working paper.
J. Greenberg and E. Mollick (2017)
“Activist Choice Homophily and the Crowdfunding of Female Founders”, Administrative Science Quarterly, Vol. 62, pp. 341-374.
D. Grimshaw and J. Rubery (2015)
“The motherhood pay gap: A review of the issues, theory and international evidence”, ILO Conditions of Work and Employment Series, No. 57.
M. Handel (2012)
“Trends in Job Skill Demands in OECD Countries”, OECD Social, Employment and Migration Working Paper No. 143.
IFR (2017)
“IFR forecast: 1.7 million new robots to transform the world’s factories by 2020”, IFR press release, 27 September, Frankfurt am Main, https://ifr.org/ifr-press-releases/news/ifr-forecast-1.7-million-new-robots-to-transform-the-worlds-factories-by-20 (last accessed 26 September 2018).
ILO (2016)
Women at Work: Trends 2016, Geneva.
ILO (2018a)
Care work and care jobs for the future of decent work, Geneva.
ILO (2018b)
World Employment and Social Outlook: Trends 2018, Geneva.
B. Javorcik, C. Ozden, M. Spatareanu and C. Neagu (2011)
“Migrant networks and foreign direct investment”, Journal of Development Economics, Vol. 94, pp. 231-241.
M. Kahanec (2012)
“Labor Mobility in an Enlarged European Union”, IZA Discussion Paper No. 6485.
M. Kahanec, M. Pytlikova and K.F. Zimmermann (2014)
“The Free Movement of Workers in an Enlarged European Union: Institutional Underpinnings of Economic Adjustment”, IZA Discussion Paper No. 8456.
G. Kalb (2009)
“Children, Labour Supply and Child Care: Challenges for Empirical Analysis”, The Australian Economic Review, Vol. 42, pp. 276-299.
W.R. Kerr (2008)
“Ethnic Scientific Communities and International Technology Diffusion”, The Review of Economics and Statistics, Vol. 90, pp. 518-537.
E. Kirby and S. Worner (2014)
“Crowdfunding: An Infant Industry Growing Fast”, IOSCO Research Department Staff Working Paper.
J. Levinsohn and A. Petrin (2003)
“Estimating Production Functions Using Inputs to Control for Unobservables”, The Review of Economic Studies, Vol. 70, pp. 317-341.
J. Manyika, M. Chui, M. Miremadi, J. Bughin, K. George, P. Willmott and M. Dewhurst (2017)
“A Future that Works: Automation, Employment, and Productivity”, McKinsey Global Institute, McKinsey & Company.
L. Marcolin, S. Miroudot and M. Squicciarini (2016)
“GVCs, Jobs And Routine Content Of Occupations”, OECD Trade Policy Paper No. 187.
K. Mayr and G. Peri (2009)
“Brain Drain and Brain Return: Theory and Application to Eastern-Western Europe”, The B.E. Journal of Economic Analysis & Policy, Vol. 9, pp. 1-52.
M. Mills, F. Tsang, P. Präg, K. Ruggeri, C. Miani and S. Hoorens (2014)
“Gender equality in the workforce. Reconciling work, private and family life in Europe”, RAND Europe.
L. Nedelkoska and G. Quintini (2018)
“Automation, skills use and training”, OECD Social, Employment and Migration Working Paper No. 202.
OECD (2017)
OECD Employment Outlook 2017, Paris.
D. Parent (2000)
“Industry-specific capital and the wage profile: Evidence from the national longitudinal survey of youth and the panel study of income dynamics”, Journal of Labor Economics, Vol. 18, pp. 306-323.
A. Saxenian (2006)
The New Argonauts, Harvard University Press.
UNICEF (1999)
Women in Transition, International Child Development Centre Regional Monitoring Report No. 6, Florence.
UN Women (2015)
Progress of the World’s Women 2015-2016: Transforming Economies, Realizing Rights, New York.
World Bank (2016)
World Development Report 2016: Digital Dividends, Washington, DC.
M. Wright, M. Hart and K. Fu (2015)
“A nation of angels: Assessing the impact of angel investing across the UK”, Enterprise Research Centre report.
Subscribe to the EBRD Transition Report 2018-19 mailing list.
Sign up to receive important announcements and emails about the Transition Report.