Geographic transition
Over the past 25 years, the EBRD regions have experienced substantial population shifts, both across and within countries. The number of people living in rural areas has steadily declined, resulting in greater population density in places with higher levels of productivity. While agglomeration enhances economic opportunities, the associated congestion and pollution can reduce the quality of life. Despite these challenges, the EBRD regions’ most densely populated areas are generally projected to achieve the largest increases in well-being over the period 2000-40. In places with declining populations, policy interventions need to target improvements in productivity and relocation opportunities for those left behind. Investment aimed at upgrading transport infrastructure (such as investment in the context of the Belt and Road Initiative) has the potential to deliver long-term benefits.
Introduction
When a worker relocates from a small town in Poland to London, there are two distinct aspects to that move. First, a working-age adult emigrates from Poland to the United Kingdom, with all of the economic and demographic implications that entails (as discussed in previous chapters). Second, a person moves from a relatively sparsely populated area (rural Poland) to a densely populated area (a city with a population of 10 million). The movement of people to more densely populated areas has economic implications of its own, and they are the focus of this chapter.
Over the past 25 years, the EBRD regions have experienced a steady process of urbanisation. The number of people living in sparsely populated areas has declined, both in absolute terms and as a percentage of the total population. Cities with populations in excess of 500,000 people have, in general, either grown or experienced lower rates of population loss than smaller cities. However, the precise nature of those population shifts has varied considerably across countries. This chapter quantifies and discusses those cross-country differences.
Unsurprisingly, people generally choose to live in places with good economic opportunities. In the EBRD regions, that leads people to move to more densely populated areas, which tend to be more productive than other places (a relationship that holds in western Europe and the United States of America (USA) as well). Moreover, places becoming more densely populated also tend to be getting more productive. Indeed, more densely populated areas benefit from agglomeration effects. Businesses are able to access larger markets of potential customers and suppliers; they benefit from larger pools of applicants when filling vacancies; and the provision of public goods and infrastructure tends to be cheaper thanks to economies of scale.
However, growing populations eventually result in congestion and pollution – phenomena that will be familiar to anyone who has visited a major city. Congestion during morning commutes, elevated noise levels and scarcity of housing all detract from people’s quality of life and encourage them to move away from the city centre. Improvements to infrastructure may allow people to redistribute outward, or create new economic opportunities and drive further consolidation into cities and central business districts.
These influences are not fully captured by measures such as GDP or productivity. To understand population movements and evaluate their impact, it is crucial to account for the effects that pollution and overcrowding have on health and well-being. In fact, most people are willing to accept a slight reduction in income in order to escape poor conditions and live in a healthier environment. The analysis in this chapter uses a spatial model that balances those competing agglomeration and dispersion forces to shed light on the long-term economic implications of population movements in the EBRD regions.
The EBRD regions’ most densely populated areas are projected to achieve the largest increases in well-being over the period 2000-40. However, that can only be achieved if congestion is kept in check. Investment in municipal infrastructure (such as public transport, water, wastewater and recycling) can help in this regard.
At the same time, in almost half of all economies in the EBRD regions, more than 50 per cent of people live in areas with declining populations. If productivity levels in those areas fall along with population density, depopulation risks will become self-reinforcing. Investment aimed at boosting economic efficiency (such as irrigation in rural communities) can help to mitigate such developments.
The spatial model that is employed in this chapter can also be used to evaluate the potential impact of transport upgrades aimed at facilitating trade. Upgrades to specific routes – such as roads and railways in the Western Balkans or transport links envisaged as part of China’s Belt and Road Initiative (BRI) – deliver economic gains to the communities that they pass through. These effects become weaker as distance from the upgraded infrastructure increases.
The first section of this chapter examines the links between changes in the spatial distribution of populations and economic performance at a highly granular level. The second section then looks at the location-specific impact of major investment in infrastructure over the longer term. The last section compares various different scenarios involving reductions in trade costs, looking at their economic impact.
Population shifts over the past 25 years
Vast population shifts have taken place across the EBRD regions and western Europe over the last 25 years. Analysis of population changes using 100 km2 grid squares shows strong population growth in major metropolitan areas such as Istanbul, London, Madrid, Milan, Moscow, Paris, Rome and St Petersburg (see Chart 4.1). In the southern and eastern Mediterranean (SEMED) region, high rates of population growth have been seen in Tunis, Cairo, parts of Morocco, the Nile valley and delta, and much of Jordan, Lebanon, the West Bank and Gaza. Meanwhile, populations have fallen in much of the Western Balkans and across large parts of central Europe and the Baltic states (CEB).
Moreover, Eurostat data for the period 2012-17 indicate declining populations on the periphery of the European Union and rising populations in the geographic heart of the EU (see Chart 4.2). Although populations generally declined in the CEB region, Spain and the Western Balkans, some places in those areas recorded strong population growth in that period.1
In particular, predominantly urban regions of Europe are much more likely to experience population growth, while the opposite is true of predominantly rural regions (see Chart 4.3 and 4.4). Indeed, predominantly urban regions of European countries have seen their populations rise by 34 per cent since 2012, compared with just 5 per cent in predominantly rural regions.
Unlike in advanced European economies, people in EBRD countries of operations in Europe are more likely to live in intermediate or predominantly rural areas (see Chart 4.4). With the exception of Turkey, those countries are also more likely to have experienced declining populations (across all three types of region).
Natural population gains have driven much of the population growth that has been observed across Turkey. Meanwhile, net migration patterns in Turkey generally mimic those seen in the EU, with net outward migration in Turkey’s interior (particularly in regions located further east) and net inflows around Istanbul, Ankara and Turkey’s western coast, where economic opportunities tend to be more abundant. The variation in these outcomes is largely lost when looking at total population change at the regional level. To address this shortcoming, the next section examines population change at a much more granular level.
Evolution of localised population density since 1990
Data compiled by the European Commission and Columbia University projects population data into 1 km2 grid squares, providing deeper insight into rural-to-urban population shifts at a local level, as well as the attendant agglomeration effects.
Data on the number of people living in the square kilometre around an individual tell a lot more about that person’s immediate environment than average population density figures. Indeed, if everyone in a 4 km2 area was forced to move into a 1 km2 corner of that area, people’s lives would be significantly affected, despite the overall population density of the 4 km2 area remaining unchanged. Likewise, the economic impact of people moving away will vary depending on whether they’re moving to a new neighbourhood 1 km away or one that is 60 km away, even if both are in a different administrative region.
In order to measure population density in the vicinity of each individual, the analysis below uses a measure of the number of people residing in all nearby geographic cells (each of which measures 1 km2), discounting people more as the distance increases.2 This measure captures everyone living within 5 km of the individual in question and is referred to as the “localised population density” of the relevant square. Localised population densities can be averaged across a country or a metropolitan area (in which case, such averages are referred to as “average localised densities”).3 In the presence of extensive depopulation, the average localised density may decline despite a population becoming substantially more concentrated in a small number of cities.
A large percentage of the people living in EBRD regions live in areas with declining populations. Indeed, the majority of economies in the CEB region experienced decreases in average localised density in the period 2000-14, with Latvia recording the greatest declines (see Chart 4.5), and the percentage of people in those economies who live in areas where localised population density declined over the period 2000-14 ranges from 40 to 90 per cent (see Chart 4.6). In south-eastern Europe (SEE), Albania stands out as an economy that has seen large increases in average localised density, while Romania has seen large decreases. Armenia, Bosnia and Herzegovina, Croatia and Montenegro have all experienced particularly sharp declines in localised population density, reflecting the scars of conflict and large-scale emigration.
The picture is different in Central Asia, the SEMED region and Turkey. These economies have seen fairly consistent increases in localised density across geographical areas, reflecting their rapid population growth (see Chapter 1). There, relatively few people live in areas that have experienced declines in localised population density (see Chart 4.6). Overall, average localised density in the EBRD regions has risen by almost 1 per cent since 2000 (see Chart 4.5).
There is a fairly strong correlation between changes in average localised density and changes in total population,4 with most economies clustered around the 45-degree line in Chart 4.7. However, that correlation is far from perfect. In Mongolia, for example, average localised density has risen far more strongly than the total population, reflecting large numbers of people concentrating in the capital city, Ulaanbaatar. Likewise, Albania has experienced a substantial increase in average localised density, despite a moderate decline in its population. Similar – though less pronounced – developments can be observed in Belarus, Bulgaria, Hungary, Russia, Serbia and Ukraine. In contrast, Estonia (not shown on the chart) has seen its average localised density decline by an average of more than 7 per cent per annum, compared with population losses of less than 1 per cent per annum, with dispersions of populations also being observed in Poland and the Slovak Republic. Outside the EBRD regions, India and the USA have seen their populations rise, while their average localised densities have remained more or less unchanged. In Italy, meanwhile, average localised density has declined, despite a small increase in the size of the population.
In fact, if we look at population changes at the 1 km2 grid level, we can see that, even in Turkey, localised population density declined in many areas between 2000 and 2014 (see Chart 4.8), particularly in smaller communities and more sparsely populated areas, while it increased further around major urban areas.
In contrast, in Jordan, Lebanon, the West Bank and Gaza, and Egypt’s Nile valley and delta, the localised population density of populated areas has increased across the board, as population growth has been fairly evenly distributed.
Concentration of populations in large cities
This section provides detailed analysis of population trends in cities, using 1 km2 grid squares similar to those employed in Chart 4.8. Across the EBRD regions, populations are increasingly becoming concentrated in larger cities. In 2000, approximately 375 million people lived in cities of various sizes in the EBRD regions, with 60 per cent of them living in cities with more than 500,000 inhabitants (see Chart 4.9). Those large cities have continued to grow, with almost half of their inhabitants experiencing large increases in localised population density between 2000 and 2014, and another 23 per cent experiencing moderate increases. In smaller cities, more than half of residents experienced at least moderate declines in localised population density. In line with the rising population density of large cities, the percentage of people living in sparsely populated areas has dropped by 6 percentage points since 1990, reflecting both intra-country and cross-border migration.5
Productivity is higher in areas with greater population density
People gravitate towards larger cities in search of economic opportunities. When firms operate close to one another in large markets, it is easier for them to source inputs, they have more potential customers nearby, and they have a larger pool of potential workers from which to select. Ideas can spread faster in more densely populated areas, fostering innovation,6 which allows consumers to access a wider variety of products. Moreover, the provision of infrastructure and other public goods tends to be cheaper per capita on account of economies of scale.
However, increases in population density can also lead to traffic congestion, noise and pollution. The loss of work and leisure time to commuting and the detrimental effects that pollution has on health can lead to a reduction in people’s well-being. Over time, congestion and pollution can encourage people to sacrifice some of their income and move away to less crowded areas. To examine how these countervailing agglomeration and dispersion forces play out, one can look at detailed data on economic activity (GDP per capita at PPP) using a 1 degree by 1 degree grid where cells represent approximately 111 km2 at the equator.
Places with higher population densities tend to also be places with higher productivity levels (see Chart 4.10). This correlation holds under regression analysis when taking account of country-specific effects, the latitude and longitude of the cell and the availability of transport infrastructure. It also holds across all regions around the world, with the exception of northern Africa and southern Asia. In the EBRD regions, a doubling of population density is associated with approximately 5 per cent higher output per capita. Furthermore, places with stronger growth in real GDP per capita over time also tend to attract more people.
This relationship also holds across cities in the EBRD regions and advanced European economies. In order to calculate output per capita for individual cities, data from the 1 degree by 1 degree grid are assigned to more granular cells in proportion to the intensity of night lights. The resulting measure of city-level output per person is then regressed on the city’s localised population density and a number of control variables. This analysis reveals that output per capita tends to be higher in more densely populated cities, in line with the theory on agglomeration effects.
Chart 4.1
Population growth has been concentrated in major metropolitan areas
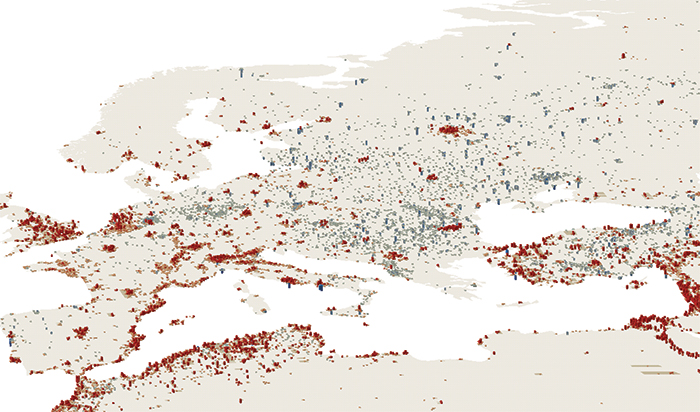
Source: European Commission, Columbia University and authors’ calculations.
Note: Based on 100 km2 grid squares for the period 1990-2015. Bar heights convey population changes, with red bars denoting population increases and grey bars indicating decreases.
Beige areas without bars are places with population changes of less than 200 people.
Chart 4.2
Net population change in Europe by NUTS-3 region
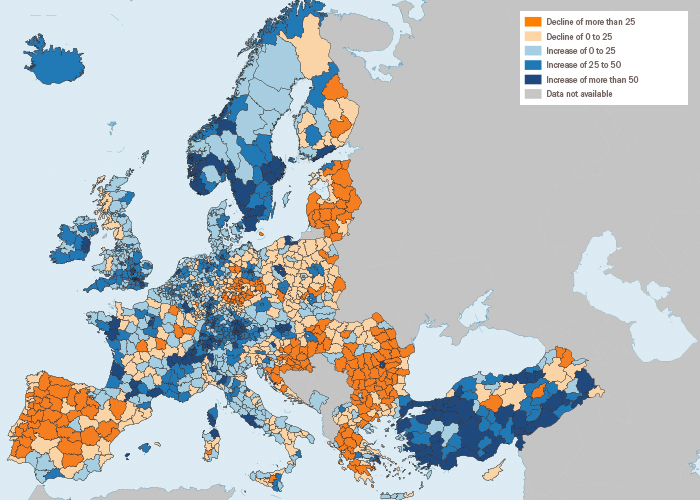
Source: Eurostat and authors’ calculations.
Note: Data relate to the period 2012-17. Changes are reported as population increases/declines per 1,000 residents on the basis of the 2012 population.
Chart 4.3
Source: Eurostat and authors’ calculations.
Note: Data relate to the period 2012-17. Changes are reported as population increases/declines per 1,000 residents on the basis of the 2012 population. “Predominantly urban”, “intermediate” and “predominantly rural” regions are defined as regions where the rural population accounts for less than 20 per cent, 20 to 50 per cent and more than 50 per cent of the total population respectively. This chart covers the following 20 countries: Austria, Belgium, the Czech Republic, Denmark, Finland, France, Germany, Iceland, Ireland, Italy, Liechtenstein, Luxembourg, Malta, the Netherlands, Norway, Portugal, Spain, Sweden, Switzerland and the United Kingdom.
Chart 4.4
Source: Eurostat and authors’ calculations.
Note: Data relate to the period 2012-17. Changes are reported as population increases/declines per 1,000 residents on the basis of the 2012 population. “Predominantly urban”, “intermediate” and “predominantly rural” regions are defined as regions where the rural population accounts for less than 20 per cent, 20 to 50 per cent and more than 50 per cent of the total population respectively.
Chart 4.5
Source: European Commission, Columbia University and authors’ calculations.
Note: Figures are based on people’s place of residence in 2014. Average localised density is the average number of people living within 5 km of each individual, discounted locally by distance.
Chart 4.6
Source: European Commission, Columbia University and authors’ calculations.
Note: Figures are based on people’s place of residence in 2014. Localised population density is a measure of the number of people living within 5 km of a person, discounted by distance.
Chart 4.7
Source: European Commission, Columbia University and authors’ calculations.
Note: Average localised density is the average number of people living within 5 km of each individual, discounted locally by distance.
Chart 4.8
Changes in localised population density around Turkey, 2000-14
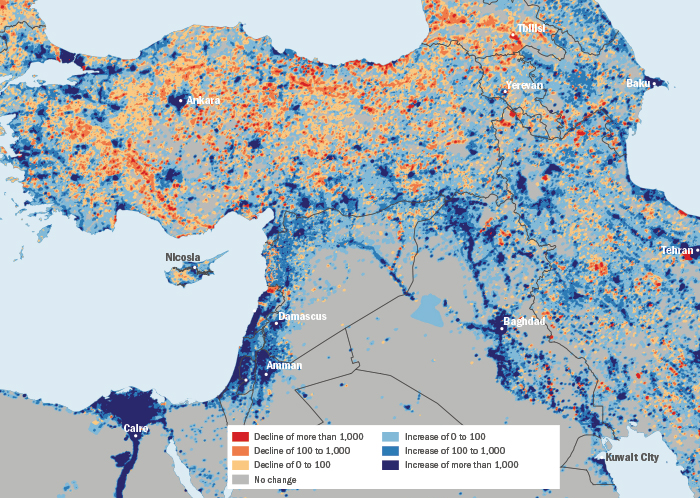
Source: European Commission, Columbia University and authors’ calculations.
Note: Localised population density is a measure of the number of people living within 5 km of a person, discounted by distance. The unit of change is the number of people in a 5 km radius.
Chart 4.9
Source: European Commission, Columbia University and authors’ calculations.
Note: Population settlements have been defined by the authors on the basis of contiguous 1 km2 cells with more than 500 inhabitants after applying a smoothing procedure.
Chart 4.10
Source: G-Econ dataset and authors’ calculations.
Note: Each dot represents a 1 degree by 1 degree cell with a minimum population of 10 people and minimum GDP per capita of US$ 7.38 at PPP.
Changes in space: linking population shifts with economic activity
Despite the strong links between higher population density and greater productivity, some large cities in the EBRD regions (such as Warsaw) have seen their populations disperse, with people moving away from densely populated city centres in search of less congested living environments (see Box 4.1).
Modelling agglomeration and dispersion effects
In order to assess the trade-offs that are associated with rising population densities, the analysis in this section uses the dynamic spatial model developed by Desmet et al. (2018). In that model, people improve their well-being by consuming goods sold by firms and enjoying the features of the location in which they live (see Box 4.2). Increases in the number of people living in an area reduce the value of local features owing to congestion. Meanwhile, increases in population density encourage firms to innovate, as they are able to spread the fixed cost of developing a new product across a larger number of potential buyers. Goods can also be traded – at a cost – across different locations, with costs depending on the quality of infrastructure. People are free to move between locations, but incur migration costs. Each person in the model chooses to live in the location that promises the highest expected level of well-being at that point in time. That links the decisions of individual people with the levels of productivity and congestion that are observed in different geographical locations. Note that the model abstracts from differences between the economic policies that are pursued in the various countries.
Agglomeration and projected output growth in the EBRD regions
Two countries with exceptionally large increases in average localised density, Albania and Mongolia (see Chart 4.7), have been examined for exceptional outcomes on the basis of the model. Both countries are estimated to achieve larger increases in real GDP per capita than certain countries and other EBRD regions with less concentrated populations shown in Chart 4.11. Likewise, Estonia, which recorded the largest decline in localised population density, is projected to achieve a relatively small increase in real GDP per capita, on account of weak agglomeration effects. At a broader level, Central Asia and China are expected to account for a larger share of the world’s population in 2040, while the combined population of the rest of the EBRD regions is projected to decline as a share of the global population. China’s growth as a share of the global population might be expected to be even stronger in reality, though the model abstracts from policy reforms carried out in reality that could otherwise affect estimates.
Places that are more densely populated today are projected, on average, to enjoy larger improvements in well-being by 2040 (see Chart 4.12), suggesting that increases in per capita consumption tend to outweigh the disutility that is associated with higher levels of congestion. On balance, the growth rates of productivity, output per capita and residents’ well-being in the EBRD regions are projected to outpace the corresponding global averages by around 1 percentage point per annum over that period. The patterns returned by this model vary across regions, as discussed in Box 4.3.
Impact of investment in transport infrastructure in the Western Balkans
The model can also be used to evaluate the impact of road and railway infrastructure by comparing new enhanced infrastructure with a baseline scenario consisting of the transport infrastructure that was in place in 2000.7 The analysis in this section starts by evaluating actual and planned investment in roads and railways in the Western Balkans since 2000 (including EBRD-backed projects), before turning its attention to the investment envisaged under China’s BRI initiative, which encompasses a large number of countries across several continents.
In the period since the early 2000s, the EBRD and its partners have supported a significant number of investment projects aimed at establishing new road and railway infrastructure in the Western Balkans and upgrading existing infrastructure, with 17 projects relating to roads and 32 relating to railways. On the basis of supporting documentation, those projects have been mapped to geographic information system (GIS) data and incorporated in the model, resulting in a new set of estimates for the cost of point-to-point transport which are lower than those incorporated in the baseline scenario.
As a result of those infrastructure projects, Albania, Bosnia and Herzegovina, FYR Macedonia, Kosovo8 and Serbia are projected to achieve cumulative increases in real GDP per capita of around 2 to 2.5 per cent by 2040 relative to the baseline scenario (see Chart 4.13). The corresponding increases in well-being range from around 1 to 1.5 per cent. These estimates are similar to those reported by Allen and Arkolakis (2014) in relation to the impact of the interstate highway system in the USA.
Areas that are further away from the location of the investment also benefit, thanks to the reduced cost of shipping goods to and through the region, as well as the impact of having relatively richer neighbours, but the overall impact is smaller. Greece, Hungary and Italy are all projected to achieve increases in income per capita and well-being, but those increases are fairly small. The impact on other economies further afield is negligible. It is also worth noting that this analysis does not identify any absolute declines in real income per capita or well-being as a result of economic activity shifting from other markets to the Western Balkans transport corridor.
Belt and Road Initiative
China’s current and suggested future investment projects around the world in the context of the Belt and Road Initiative (BRI) are a matter of great interest. The analysis in this section evaluates the impact that BRI-sponsored investment in roads and railways could potentially have on trade (and, ultimately, per capita incomes and well-being), abstracting from the cost of such investment and all wider environmental and geopolitical considerations. The impact of investment in maritime infrastructure also lies outside the scope of this analysis, as the model does not account for additional frictions involved in the transfer of goods from land to the sea and vice versa.
The first scenario used in this analysis (“planned” BRI investment) envisages a relatively limited set of road and railway infrastructure projects with a high likelihood of completion. Some of these may have been completed by now, or construction may be about to start (see solid lines in Chart 4.14). The second scenario (“ambitious” BRI investment) also incorporates a set of potential railway investment projects spanning Eurasia (see dotted lines in Chart 4.14). Those projects serve three main transport routes: a northern route stretching through Russia and parts of central Europe; a southern route running through China and parts of Central Asia, which drops down through Iran and Turkey before working its way through south-eastern Europe; and a middle route which branches off from the other two and covers parts of Central Asia, passing via the Caspian Sea and possibly also the Black Sea. Concrete plans for the construction of these railway lines do not appear imminent, and if these projects do go ahead, they are not certain to be financed via the BRI.
Adapting those investment projects for use in the model requires a set of assumptions. First, all roads and railways are assumed to be fully accessible anywhere along the route. For railways, this is equivalent to placing major stations at intervals of around 100 km (so that each 1 degree by 1 degree cell has a station). Second, BRI-supported rail upgrades are assumed to result in transport costs that are 80 per cent lower than the standard rate applied to railways, on account of the assumed large capacities of those rail links and the fact that expected improvements in supporting logistics should lead to significantly reduced transfer times. Lastly, BRI-supported rail segments are, for the purposes of this exercise, assumed to end at the western border of the EBRD regions, before continuing into advanced European economies as ordinary rail links.
The results of these simulations show substantial gains by 2040 in areas that are direct recipients of BRI-supported investment, with increases in output per capita and well-being dissipating across nearby areas (see Chart 4.15). The overall pattern is similar to that observed in the case of the Western Balkans.
Real GDP per capita in Kazakhstan, Mongolia and Uzbekistan is estimated to be around 4 to 6 per cent higher than it would be in the absence of infrastructure investment supported by the Belt and Road Initiative. These gains reflect the much-improved access to international markets in those land-locked economies and exceed the estimates for China, where real GDP per capita is projected to increase by 3 per cent relative to the baseline scenario. Similar increases in per capita output are estimated for Hungary, Russia, the Slovak Republic and Turkey. In the SEE region, output per capita is estimated to increase by around 2 per cent relative to the baseline in Bulgaria and Serbia, with more modest gains in other economies. The impact on economies in the SEMED region is minimal, as those economies are relatively far removed from the planned infrastructure upgrades.
The impact on well-being closely follows the patterns observed for real GDP per capita. In the Kyrgyz Republic, gains in terms of well-being are projected to outpace increases in income per capita, suggesting that the decline in trade costs on account of improved road and rail links will encourage people to move to nicer areas and possibly reduce congestion. An additional boost to average well-being comes from some limited relocation of populations within countries, with people moving to areas that are directly benefiting from investment in new transport infrastructure. Such relocation also has the potential to reduce congestion in large cities that are not located directly on routes supported by the Belt and Road Initiative.
Chart 4.11
Source: Authors’ calculations.
Note: Based on model estimates (see Box 4.2 for details).
Chart 4.12
Source: Authors’ calculations.
Note: Based on population-weighted average model estimates for the period 2000-40. Average localised densities have been obtained using 1 km2 grid cells.
Chart 4.13
Source: Authors’ calculations.
Note: Estimates for Kosovo are not available, but are reflected in those of its neighbours.
Chart 4.14
Planned and ambitious Belt and Road Initiative investment projects
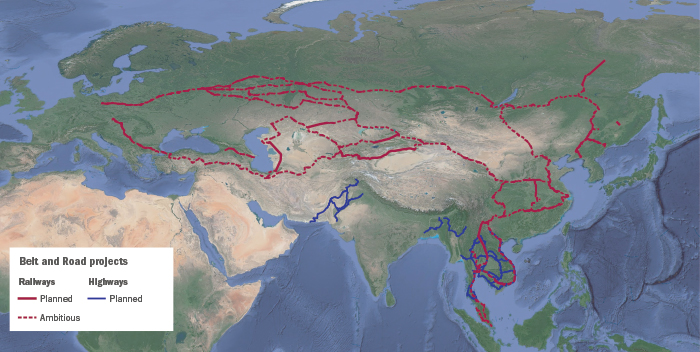
Source: Mercator Institute for China Studies and authors.
Note: “Planned” investment projects are projects where construction has been completed, is under way or is about to start. “Ambitious” projects, in contrast, comprise an extensive set of hypothetical routes.
Chart 4.15
Source: Authors’ calculations.
Note: This “ambitious” scenario includes the hypothetical routes depicted in Chart 4.14.
Comparing different scenarios involving reductions in trade costs
A uniform reduction in trade costs across the EBRD regions and Asia
Policies aimed at reducing the cost of trade are not limited to investment in infrastructure. They may also target improvements in logistics or the adoption of common health and safety standards, or they may involve other measures aimed at lowering non-tariff barriers. As a thought experiment, this section investigates the impact of achieving a uniform reduction in bilateral trade costs with no changes to supporting infrastructure (which remains unchanged from the baseline scenario). In this scenario, the reduction in trade costs applies to both domestic and international trade. In absolute terms, cost reductions will be higher for international trade, as initial trade costs tend to be higher over greater distances.
The first scenario considers a simultaneous reduction in trade costs across the EBRD regions, east Asia and south-east Asia. These regions are broadly connected by the projects involved in the ambitious BRI scenario. Analysis of this scenario reveals that a 2 per cent reduction in trade costs across all locations in this area delivers the same boost to world output per capita as the infrastructure upgrades in the ambitious BRI scenario or a 2 per cent reduction in trade costs across the EBRD regions and advanced European economies by 2040. (see Table 4.1).9 However, in the case of China and Russia, both of which are direct recipients of infrastructure upgrades under the ambitious BRI scenario, a uniform reduction in trade costs of around 3 per cent would be required in order to achieve the same impact on real GDP per capita as the ambitious BRI scenario. These estimates involve a large margin of error on account of the underlying assumptions (which include an assumed 80 per cent reduction in railway transport costs over rail segments covered by the ambitious BRI scenario). In contrast, increases in GDP per capita average less than 0.02 per cent across all regions in the planned BRI scenario.
A uniform reduction in trade costs across the EBRD regions and advanced European economies
The second scenario envisages an equivalent reduction in trade costs across the EBRD regions and advanced European economies.10 The associated increase in output per capita in the EBRD regions is similar to that estimated for the scenario involving a reduction in trade costs across the EBRD regions and parts of Asia. The specific estimates for Russia and Turkey are also similar to those obtained for the previous scenario.
Global output per capita increases slightly more in response to reduced trade costs across the EBRD regions and advanced European economies than it does in response to reduced trade costs across the EBRD regions and parts of Asia, as reducing trade costs in today’s higher-productivity region (Europe) incentivises additional migration to those locations and encourages increased investment in innovation owing to the agglomeration forces discussed earlier, reinforcing the higher levels of productivity in those places.
Average global well-being increases significantly more in response to reduced trade costs across the EBRD regions and advanced European economies than it does in response to a similar reduction in trade costs across the EBRD regions and parts of Asia. This is because the changes to trade costs in that first scenario incentivise people to migrate to areas where the quality of amenities is currently higher, reflecting lower levels of congestion and pollution.
The different scenarios that are compared in Table 4.1 need not be mutually exclusive. Policies that reduce trade frictions at a regional or global level have the potential to complement major investment in infrastructure, amplifying the positive impact on output per capita and well-being across all trading partners. In addition, analysis suggests that relatively small uniform reductions in the cost of trade across a large number of markets can achieve the same gains as highly ambitious transport infrastructure projects.
Table 4.1
Estimated impact of reducing trade costs relative to the baseline scenario (in percentage terms)
|
Belt and Road Initiative |
2 per cent reduction in trade costs |
| Planned upgrades |
Ambitious upgrades |
EBRD regions + east Asia + south-east Asia |
EBRD regions + advanced European economies |
| (2) |
(3) |
(4) |
(5) |
| Real GDP per capita |
| World |
– |
0.6 |
0.7 |
0.9 |
| EBRD regions |
– |
1.7 |
1.8 |
1.8 |
| China |
– |
2.9 |
2.1 |
0.0 |
| Russia |
– |
2.9 |
1.8 |
1.7 |
| Turkey |
– |
3.1 |
1.9 |
1.9 |
| Average well-being |
| World |
0.2 |
0.4 |
0.2 |
0.5 |
| EBRD regions |
0.1 |
1.7 |
1.8 |
1.5 |
| China |
0.1 |
2.0 |
1.9 |
0.1 |
| Russia |
0.1 |
1.7 |
1.8 |
1.4 |
| Turkey |
0.1 |
1.8 |
1.8 |
1.5 |
SOURCE: Authors’ calculations.
NOTE: Estimates for the 2 per cent reduction are linearly extrapolated from results modelling a 1.0 per cent uniform reduction in the relevant areas. Estimates smaller than one-tenth of a per cent after rounding are suppressed.
Conclusion
The EBRD regions have experienced dramatic changes in the concentration of populations and the geographical distribution of economic activity over the last 25 years. Central Asia, the SEMED region and Turkey have experienced strong population growth, while the populations of many economies in central, eastern and south-eastern Europe and the Caucasus have declined.
Detailed population data at the level of 1 km2 cells show that, across the EBRD regions, populations have shifted towards large cities, while population density in rural areas and many smaller cities has declined further. In almost half of all countries in the EBRD regions, more than 50 per cent of the population live in places where the localised population density – a distance-weighted measure of the number of people residing in a 5 km radius – has declined since 2000. In Turkey, for instance, rapid overall population growth has been concentrated in and around provincial capitals, with widespread declines in the numbers of people living in small towns in more remote areas.
Areas with greater population density tend to have higher levels of output per capita, both within the EBRD regions and at a global level, reflecting agglomeration effects. Large cities give firms access to large markets and large pools of potential applicants for vacancies, while the provision of infrastructure tends to be cheaper as a result of economies of scale.
On the other hand, high levels of population density result in congestion, noise and environmental pollution. These take their toll on the well-being of people living in particularly dense environments and incentivise them to move outward and forego some of their consumption potential in return for better amenities. These opposing agglomeration and dispersion forces produce different net effects in different places. For instance, agglomeration forces have dominated in Moscow in recent decades, while the population of central Warsaw has been dispersing.
In order to examine the trade-offs between agglomeration and dispersion forces, the analysis in this chapter used a model of the spatial economy that was developed by Desmet et al. (2018), which estimates real GDP per capita and well-being, among other outcomes, in each cell of a 1 degree by 1 degree grid. In that model, reductions in the cost of trade (including reductions on account of improvements in the quality of transport infrastructure) enable firms to reach out to larger markets, strengthen incentives to innovate and encourage people to migrate to areas with greater economic opportunities.
According to the analysis in this chapter, current and planned investment in transport infrastructure in the Western Balkans and the ambitious scenario for the Belt and Road Initiative (which envisages major improvements in road and railway capacity across Asia and Europe) are both projected to result in increases in real GDP per capita and well-being in countries that are direct recipients of infrastructure upgrades. Those effects are particularly large in the immediate vicinity of the infrastructure corridors in question.
Investment in public transport, water and waste treatment can help to relieve the pressures that rising population densities place on major cities and leverage the economic benefits that agglomeration can provide. Meanwhile, in places with dwindling populations, there is potential for declining productivity and further population losses to become self-reinforcing. Policy interventions in these areas need to target increases in productivity (for instance, through improved irrigation in agriculture), as well as relocation opportunities for those left behind.
BOX 4.1. Agglomeration and dispersion forces at work
Cities simultaneously attract people through promises of economic opportunity and amenities, while repelling them as a result of nuisances such as overcrowding and pollution. Together, these agglomeration and dispersion forces influence changes in population at local levels. When people weigh up the pros and cons of moving to a new location, they take these factors into account, together with the cost of moving.
As a result, patterns of population change vary from location to location (see Chart 4.1.1). In Moscow, for example, agglomeration forces dominate, with localised population density increasing in the centre of the city and declining on the periphery. Transport opportunities around the Russian capital have resulted in people relocating to the city centre in pursuit of higher levels of productivity and easy outward transportation of goods (see black lines on chart, which denote major roads). In contrast, localised population density in the centre of Warsaw has been falling, with dispersion forces dominating. Residents of the Polish capital have been moving away from congested areas in order to benefit from the more spacious housing, lower rents and higher-quality amenities that are available outside the city centre. Upgrades to Poland’s railway system may have facilitated such developments by increasing the number of areas from which residents can commute to work at a reasonable cost.
Natural features such as rugged terrain can shape a city’s geography, with consequences for industry and productivity.11Similarly, artificial barriers such as landmines left over from an armed conflict can restrict connectivity between nearby markets, compounding the human suffering that resulted from the conflict by causing long-lasting economic inefficiencies.12 Investment in transport infrastructure, on the other hand, can have a transformative impact on an economy by fostering the mobility of goods and people, and overcoming natural barriers.13
Policy responses to urban congestion
The provision of infrastructure in densely populated urban environments tends to be relatively cost-effective in per capita terms, as new facilities serve large numbers of people. Projects aimed at tackling the congestion and pollution that are associated with urban growth help people to enjoy the benefits of living in large markets. The returns to such investment are likely to be particularly high in the SEMED region and Turkey, where urbanisation has been especially rapid, driven by strong natural population growth and, in some cases, an influx of refugees fleeing nearby conflicts. In major population centres such as Cairo, investment in public transport can help to make it easier to move around, while in smaller cities such as Batumi in Georgia, investment in electric buses can help to reduce the pollution generated by road traffic. Sometimes overlooked, but no less important, is investment in the removal of solid waste and the efficiency of landfills, and recent projects in Amman and Dushanbe are good examples of such initiatives.
Chart 4.1.1
Changes in localised population density, 2000-14
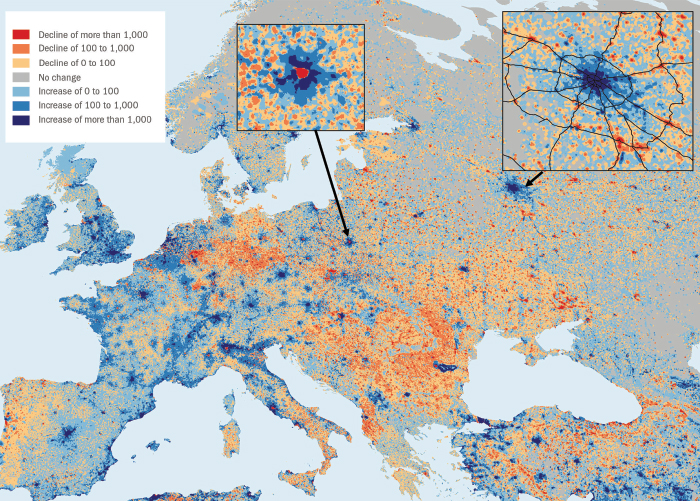
Source: European Commission, Columbia University and authors’ calculations.
Note: Localised population density is a measure of the number of people living within 5 km of a person, discounted by distance. The unit of change is the number of people in a 5 km radius.
BOX 4.2. A spatial model of agglomeration and congestion effects
This box highlights key features and assumptions of the model developed by Desmet et al. (2018) as applied to the EBRD regions. Locations are considered in two dimensions, like places on a map, as in Allen and Arkolakis (2014). Each location, which exhibits a unique set of amenities and productivities, houses firms. Firms produce goods and choose how much to innovate in order to improve their productivity. The ability of firms to sell to other locations depends on transport costs.
People choose where to live on the basis of the level of consumption a place offers, after taking account of relocation costs and the amenities they can enjoy, in addition to idiosyncratic preferences. The value of local amenities can be eroded on account of congestion.
The assumption of agglomeration economies features prominently in the model’s dynamics, drawing on Desmet and Rossi-Hansberg (2014). Locations with higher population densities innovate more, as they benefit from access to broader customer bases. Some locally generated advances in technology spread to the rest of the world, benefiting firms in other locations.
Increases in output per capita in densely populated areas help those locations to attract more people, further increasing local returns to innovation. At the same time, congestion effects reduce the value of local amenities as populations rise, productive returns from the land decline on account of overcrowding, and high-income cities become more costly to migrate to.
This model divides the Earth’s surface into a 1 degree by 1 degree grid, with a total of 64,800 cells. Real GDP and population data for 2000 and 2005 are taken from the G-Econ dataset. Subjective measures of well-being taken from the Gallup World Poll help to pin down the initial quality of local amenities. The cost of transport across each cell is calculated on the basis of GIS data on the location of minor and major roads, railways and waterways taken from www.NaturalEarthData.com. An algorithm is used to determine the least costly route for each pair of cells. Other key parameters of the model are taken from various different studies.
Importantly, the model abstracts from a number of issues. For instance, political borders do not exist in the model. While migration policies across countries are captured in the estimated costs of migrating to a given location, political borders have no impact on trade. Also, transport costs do not account for air transport or the cost of handling goods locally (for instance, when transferring goods in railway yards or at ports).
Despite its natural limitations, the model performs well against historical data. The ratio of international trade to global GDP that is estimated by the model for the period 2000-01 matches the actual level for the year 2000. When the model is run backwards in time, the degree of correlation between estimated outcomes and historical data remains high, with a solid performance going back 130 years (beyond which data cease to be available).
BOX 4.3. Expected evolution of output per capita across 64,800 locations over the period 2000-40
This box looks at the disaggregated results of the modelling exercise at the level of 1 degree by 1 degree cells (of which there are 64,800, with cells covering approximately 111 km2 at the equator). The strongest growth in GDP per capita (expressed in constant prices) over the period 2000-40 occurs in places with high population densities today, with particularly high growth rates in sub-Saharan Africa and south and south-east Asia. Places where levels of productivity are currently high, such as North America and western Europe, still show growth, but that growth is weaker than it is in much of the EBRD regions and Latin America (see Chart 4.3.1). An increase in relocation to North America and western Europe, which currently involves high migration costs for immigrants, would lead to stronger growth in those economies, as can be seen in Desmet et al. (2018). Areas experiencing stronger growth in output per capita will attract proportionally more new inhabitants.
While many densely populated places around the world (such as large cities in lower-income economies in south Asia and sub-Saharan Africa) currently exhibit low levels of productivity, this model expects to see higher rates of productivity growth in such locations in the future as access to large markets incentivises firms to invest and innovate. Here, the model abstracts from constraints on innovation in lower-income economies, such as deficiencies in terms of economic and political institutions. Moreover, while the world’s most densely populated locations are expected to achieve the strongest productivity growth, economic convergence will take a long time to complete, and today’s high-income locations will still be enjoying relatively high levels of consumption and well-being in 2040.
Places with strong population growth experience increases in congestion, noise and environmental pollution, while competition for scarce land resources drives rents up. This cuts into disposable income and personal well-being, reducing the extent to which people can enjoy their homes and limiting the goods and services that they can afford to purchase. For these reasons, estimated increases in well-being tend to be smaller than increases in real GDP per capita (see Chart 4.3.2).
Many of the countries in the EBRD regions do not have high initial levels of population density, with the exception of some parts of the SEMED region (such as the Nile valley and the eastern Mediterranean). In this model, the EBRD regions benefit from the moderate cost of relocating there and the fairly high quality of the amenities available to residents. In addition, economies benefit from transfers of knowledge from abroad (as discussed in Chapter 2). In this model, knowledge is transferred from densely populated areas with high rates of innovation to neighbouring regions.
Chart 4.3.1
Estimated growth in GDP per capita, 2000-40 (per cent)
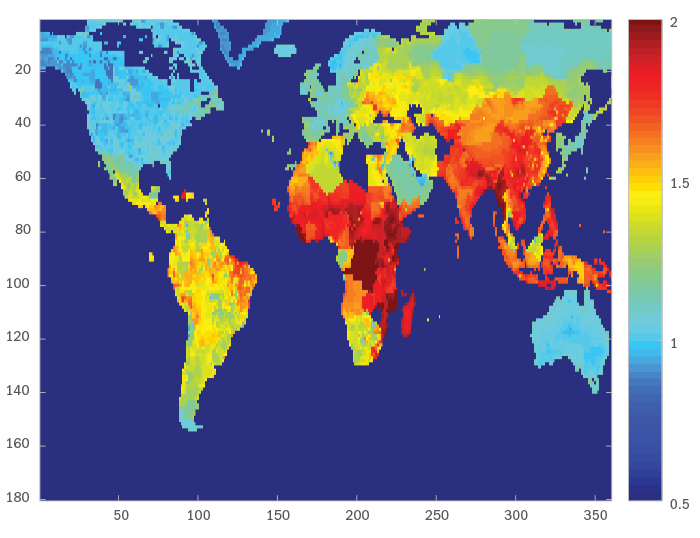
Source: Authors’ calculations.
Note: See Box 4.2 for a description of this model.
Chart 4.3.2
Estimated growth in well-being, 2000-40 (per cent)
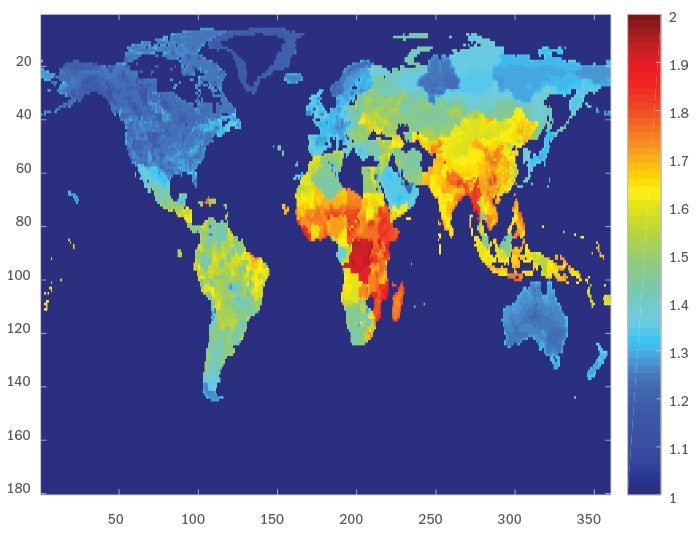
Source: Authors’ calculations.
Note: See Box 4.2 for a description of this model.
References
T. Allen and C. Arkolakis (2014)
“Trade and the Topography of the Spatial Economy”, The Quarterly Journal of Economics, Vol. 129, pp. 1085-1140.
P. Cadavid, G. Cineas, L. Quintero and S. Zhukova (2017)
“Cities in Eastern Europe and Central Asia: A Story of Urban Growth and Decline”, World Bank Report No. AUS12288.
G. Chiovelli, S. Michalopoulos and E. Papaioannou (2018)
“Appendix VII: Details and Sensitivity Analysis, Market Access Effects”, in Landmines and Spatial Development.
J. De La Roca and D. Puga (2017)
“Learning by working in big cities”, The Review of Economic Studies, Vol. 84, pp. 106-142.
K. Desmet, D. Nagy and E. Rossi-Hansberg (2017)
“Asia’s Geographic Development”, Asian Development Review, Vol. 34(2), pp. 1-24.
K. Desmet, D. Nagy and E. Rossi-Hansberg (2018)
“The geography of development”, Journal of Political Economy, Vol. 126, pp. 903-983.
K. Desmet and E. Rossi-Hansberg (2014)
“Spatial Development”, American Economic Review, Vol. 104(4), pp. 1211-1243.
G. Duranton and D. Puga (2004)
“Micro-foundations of urban agglomeration economies”, Handbook of Regional and Urban Economics, Vol. 4, pp. 2063-2117.
European Commission (Joint Research Centre) and Columbia University (Center for International Earth Science Information Network) (2015)
GHS population grid, derived from GPW4, multitemporal (1975, 1990, 2000, 2015).
Eurostat (2017)
Eurostat regional yearbook, Luxembourg.
P. Fajgelbaum and S. Redding (2014)
“External integration, structural transformation and economic development: Evidence from Argentina 1870-1914”, NBER Working Paper No. 20217.
M. Harari (2016)
“Cities in bad shape: Urban geometry in India”, University of Pennsylvania working paper.
T. Mayer, V. Vicard and S. Zignago (2018)
“The Cost of Non-Europe, Revisited”, Banque de France Working Paper No. 673.
S. Rosenthal and W. Strange (2004)
“Evidence on the nature and sources of agglomeration economies”, Handbook of Regional and Urban Economics, Vol. 4, pp. 2119-2171.